Cube-based sports event information visualization method

A sports and cube technology, applied in 2D image generation, image data processing, special data processing applications, etc., can solve the problems of difficult to effectively interpret visualization results, unfixed hierarchical relationships, and difficult to represent annotation information.

Active Publication Date: 2012-06-20
BEIHANG UNIV
View PDF6 Cites 26 Cited by
  • Summary
  • Abstract
  • Description
  • Claims
  • Application Information

AI Technical Summary

Problems solved by technology

The filled rectangular tree structure diagram can effectively use the display space without additional elements, but its visualization results are difficult to be effectively interpreted
In 2006, researchers from Loughborough University in the United Kingdom and Stanford University in the United States proposed a nested rectangular tree structure diagram at the Information Visualization Conference to visualize enterprise storage data. This method comprehensively uses variable lines between nodes. Width, rectangle filling, labeling information, etc. to express the hierarchical relationship. Although the labeling information of different levels is given different colors and positions, it is still difficult to express the labeling information at the same level.
[0006] Therefore, because most of the sports event information is multi-dimensional data, which has strong hierarchical characteristics, but its hierarchical relationship is not fixed and complex (even with an abstract graph structure), it is difficult to use the existing rectangular tree structure graph to visualize the data. Class Cube

Method used


Image

  • Cube-based sports event information visualization method
  • Cube-based sports event information visualization method
  • Cube-based sports event information visualization method

Examples


Embodiment Construction

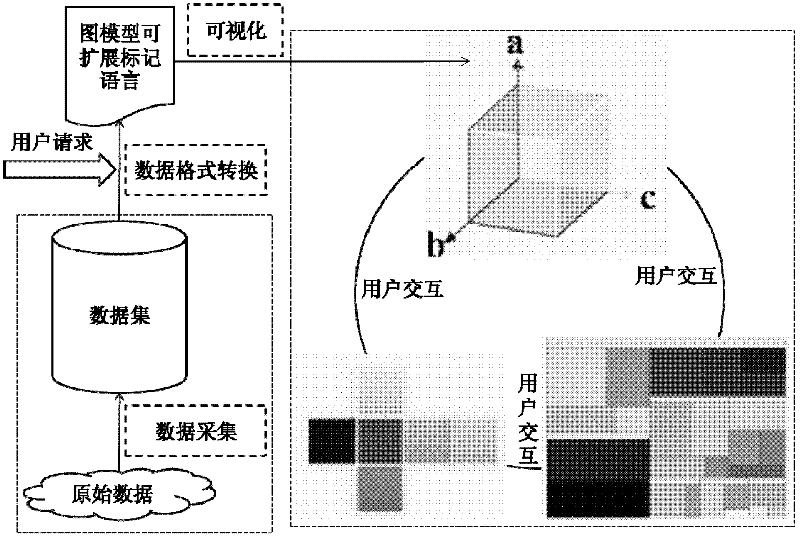
[0027] figure 1As shown, the present invention adopts the browser / server mode and mainly includes three components of data collection, data format conversion and visualization. The server side includes two parts: data acquisition and data format conversion. Tomcat responds to the user request of the browser client, and provides data support for the browser client through access to the sports event data set. The browser client completes the relevant work of the visualization part, and uses Java Applet technology to visualize the data. The data exchange between the browser client and the server adopts the graph model extensible markup language.

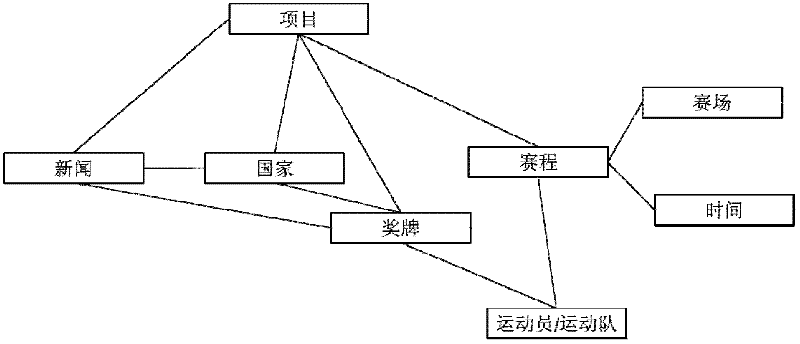
[0028] The data acquisition part is mainly to analyze and collect sports event data, use the hierarchy to represent a class of information in sports events, and establish a multi-dimensional hierarchical structure of event data. Through analysis, the sports event data is divided into eight categories: schedule, project, country, medal...


PUM


Abstract

The invention discloses a cube-based sports event information visualization method which comprises the following steps of: establishing a multi-dimensional hierarchical structure of the event data; converting the collected multi-dimensional hierarchical data instance of the sports event into a graphical model extensible markup language format according to the user request; defining a cubic layout for visualizing the sports event information; establishing a cube in a visualization area, designating a layer for each dimension of the cube by the user, and establishing a mapping relationship between the data layers and the cube dimensions; generating an algorithm and a label cloud algorithm by use of a rectangular tree structure chart, generating a corresponding rectangular tree structure chart for each surface of the cube, and generating a cubic view; and providing scaling, returning, rotation, expansion and merging interactive operations, and generating a tiled view and a rectangular view for the user respectively. The method disclosed by the invention can visualize the hierarchical relationship of multi-dimensional data, and can be popularized to the fields of education training, digital entertainment, sports research, drill analysis and the like.

Description

technical field [0001] The invention relates to the fields of information visualization, computer graphics and virtual reality, and relates to a cube-based sports event information visualization method, specifically an information visualization method for multi-dimensional hierarchical data in sports event information. Background technique [0002] Information visualization is an interdisciplinary field that studies the visual representation of abstract data sets, such as unstructured text or points in high-dimensional space (these points do not have inherent two-dimensional or three-dimensional geometric structure), and the use of graphical images and other technologies and methods to help people understand and analyze data. Hierarchical relationship is a ubiquitous relationship in abstract data sets, which is reflected in different application scenarios. Data with hierarchical relationships is called hierarchical data. The data model of hierarchical data is generally exp...

Claims


Application Information

Patent Timeline
Patent Type & Authority Applications(China)
IPC IPC(8): G06T17/00G06F17/30
CPCG06T11/206
Inventor 陈小武赵沁平周彬马永焘杨昊林
Owner BEIHANG UNIV
Why Eureka
Try Eureka