Thermodynamic diagram display method and device

A heat map and thermal technology, applied in special data processing applications, instruments, electrical and digital data processing, etc., can solve the problem that the heat map cannot clearly show the distribution of statistical index data, and the reliability of the heat map display is reduced. Demonstrate reliability and improve display efficiency

Active Publication Date: 2015-06-24
BAIDU ONLINE NETWORK TECH (BEIJIBG) CO LTD
View PDF4 Cites 27 Cited by
  • Summary
  • Abstract
  • Description
  • Claims
  • Application Information

AI Technical Summary

Problems solved by technology

[0003] However, due to the attenuation relationship completely dependent on the set statistical index data, the heat map cannot clearly show the distribution of the statistical index data of the image, which leads to the reduction of the reliability of the heat map display

Method used


Image

  • Thermodynamic diagram display method and device
  • Thermodynamic diagram display method and device
  • Thermodynamic diagram display method and device

Examples


Embodiment Construction

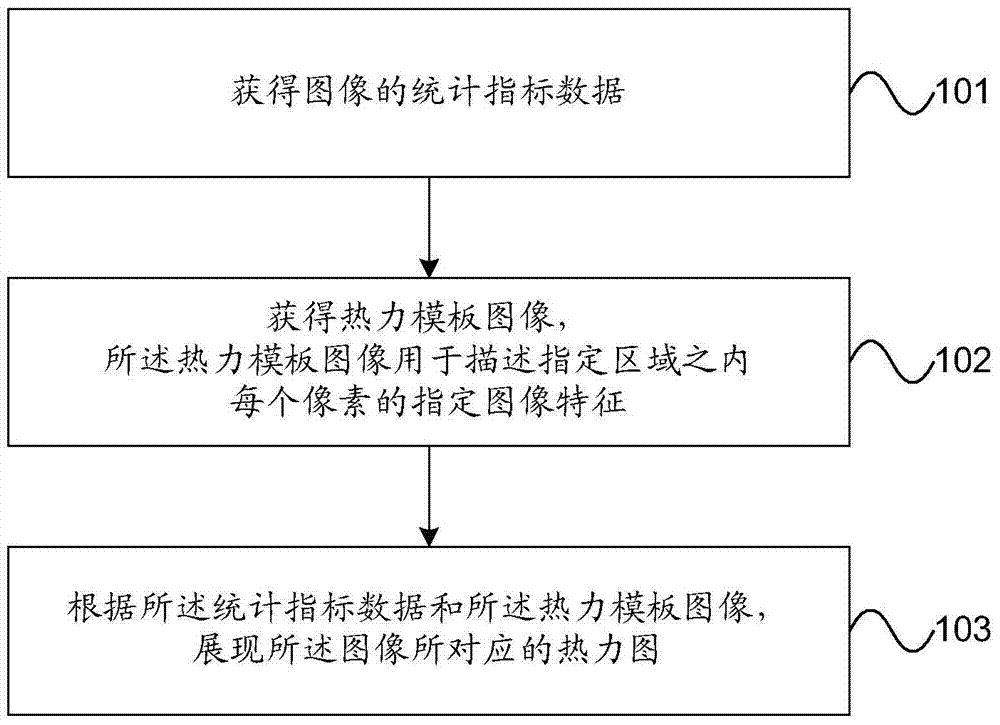
[0083] In order to make the purpose, technical solutions and advantages of the embodiments of the present invention clearer, the technical solutions in the embodiments of the present invention will be clearly and completely described below in conjunction with the drawings in the embodiments of the present invention. Obviously, the described embodiments It is a part of embodiments of the present invention, but not all embodiments. Based on the embodiments of the present invention, all other embodiments obtained by persons of ordinary skill in the art without creative efforts fall within the protection scope of the present invention.

[0084] It should be noted that the terminals involved in the embodiments of the present invention may include, but are not limited to, mobile phones, personal digital assistants (Personal Digital Assistant, PDA), wireless handheld devices, tablet computers (Tablet Computer), personal computers (Personal Computer, PC ), MP3 players, MP4 players, we...


PUM


Abstract

The invention provides a thermodynamic diagram display method and device. Statistics index data of an image and a thermodynamic template image are obtained, the thermodynamic template image is used for depicting designated image features of each pixel on the thermodynamic template image, and a thermodynamic diagram corresponding to the image can be displayed according to the statistics index data and the thermodynamic template image; the thermodynamic diagram is displayed by combining the thermodynamic template image instead of completely depending on the set attenuation relation of the statistics index data, and therefore the problem that in the prior art, by completely depending on the set attenuation relation of the statistics index data, the distribution conditions of the statistics index data of the image of a thermodynamic diagram can not be clearly displayed is solved, and therefore the display reliability of the thermodynamic diagram is improved.

Description

【Technical field】 [0001] The present invention relates to heat map technology, in particular to a display method and device for heat map. 【Background technique】 [0002] A heat map can obtain several statistical index data according to certain statistical standards, and use a special highlighted form to represent the size of the statistical index data of each area in the image, so as to intuitively display the global characteristics of the area in front of people. way. Heat maps can be applied to various images. For example, map heat maps are a service that uses blocks of different colors to be superimposed on the map to describe crowd distribution, density and changing trends in real time. It is a convenient travel service based on Baidu big data . Usually, each statistical indicator data can correspond to a display center position and a display area in the heat map. The display center position is the actual position of the statistical indicator data, and the radius of th...

Claims


Application Information

Patent Timeline
Patent Type & Authority Applications(China)
IPC IPC(8): G06F17/30
CPCG06F16/00G06F16/9577G06F16/9537
Inventor 张文波
Owner BAIDU ONLINE NETWORK TECH (BEIJIBG) CO LTD
Why Eureka
Try Eureka