Visual Analysis Method of Vibration Acceleration Signal Spectrum

A technology of vibration acceleration and signal spectrum, which is applied in the testing of mechanical components, testing of machine/structural components, instruments, etc., can solve problems such as complex vibration acceleration signals and difficult extraction of diagnostic information, and achieve the effect of simple analysis process

Active Publication Date: 2018-12-18
XI AN JIAOTONG UNIV
View PDF10 Cites 0 Cited by
  • Summary
  • Abstract
  • Description
  • Claims
  • Application Information

AI Technical Summary

Problems solved by technology

However, the vibration acceleration signal is affected by factors such as the transmission path of the vibration signal, the installation error of the sensor, the gap between the components transmitting the vibration, and the natural vibration of the monitoring components, resulting in an extremely complex vibration acceleration signal, which makes it difficult to extract fault characteristics using existing signal analysis methods
Taking rolling bearings as an example, the fault source of the equipment to the acceleration sensor has to pass through multiple components, and the vibrations between these components have their own characteristic frequencies; at the same time, rolling bearings and bearing housings also have natural vibrations ranging from thousands of hertz to tens of kilohertz frequency; in addition, when the lubrication state of the bearing is poor, the non-linear accompanying vibration of the rolling element may be caused by the high-order multiplier and sub-multiple frequency of the rotation frequency of the shaft; in addition, there are resonance frequencies of the acceleration sensor, these frequencies Mixture of components makes extraction of diagnostic information extremely difficult

Method used


Image

  • Visual Analysis Method of Vibration Acceleration Signal Spectrum
  • Visual Analysis Method of Vibration Acceleration Signal Spectrum
  • Visual Analysis Method of Vibration Acceleration Signal Spectrum

Examples


Embodiment Construction

[0026] The present invention will be further described in detail below in conjunction with the accompanying drawings and embodiments.

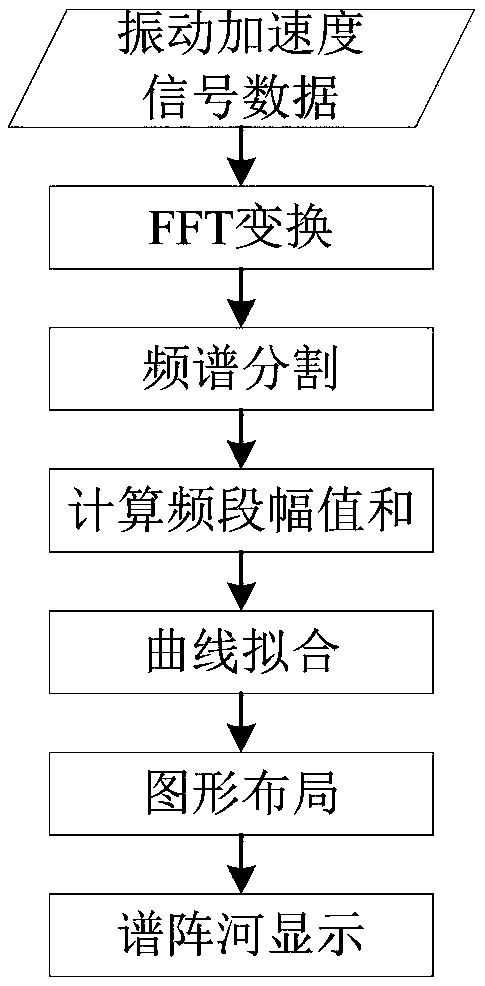
[0027] refer to figure 1 , a visual analysis method for vibration acceleration signal spectrum, comprising the following steps:

[0028] 1) Perform Fourier transform on the vibration acceleration signal to obtain the signal spectrum amplitude sequence {A i}(i=1,2,...,N), N is the number of sampling points;

[0029] 2) In the frequency spectrum of the vibration acceleration signal, the frequency points with monitoring value and the corresponding amplitudes of their adjacent points are generally larger, and the area formed by these points is a high-energy area, and the monitoring significance between each high-energy area is not great. According to the characteristics of the frequency spectrum curve of the vibration acceleration signal, the boundary position of the high and low energy areas is selected as the frequency band division point, and...


PUM


Abstract

The invention provides a vibration acceleration signal frequency spectrum visual analysis method. Firstly the frequency spectrum data of vibration acceleration signals are obtained by performing Fourier transform; then the vibration acceleration signal frequency spectrum is segmented according to the high and low energy area boundaries, and statistics of the sum of amplitude of frequency components in each branch frequency band is performed; and finally a spectrum array river changing along with time is established with the sum of the amplitude of the frequency band acting as the characteristic index so as to realize visual display. Characteristic information extraction of the complex vibration acceleration signals can be realized so that the full life cycle operation state of mechanical equipment can be simply and visually reflected.

Description

technical field [0001] The invention belongs to the field of state monitoring and fault diagnosis of mechanical equipment, and in particular relates to a visual analysis method of vibration acceleration signal frequency spectrum. Background technique [0002] Condition monitoring and fault diagnosis are of great significance to ensure the safe operation of mechanical equipment. Once an accident occurs in mechanical equipment, it will not only cause huge economic losses, but may also cause casualties. During the operation of mechanical equipment, vibration acceleration signals will be excited. This signal contains important information about the status of the equipment and is the most commonly used signal for status monitoring and fault diagnosis. By analyzing the vibration acceleration signal, it is of great significance to find the abnormal state or failure of the mechanical equipment as soon as possible, which is of great significance to guide the maintenance and maintenan...

Claims


Application Information

Patent Timeline
Patent Type & Authority Patents(China)
IPC IPC(8): G01M13/00G01M13/04G01H17/00
CPCG01H17/00G01M13/00G01M13/045
Inventor 张庆褚世杰
Owner XI AN JIAOTONG UNIV
Why Eureka
Try Eureka