Method for drawing dynamic control charts on basis of combination of calculation and statistics

A dynamic control and combination technology, which is applied in the direction of earthwork drilling, production fluid, wellbore/well components, etc., can solve the problem that regional boundaries cannot meet fine management

Inactive Publication Date: 2018-06-29
SHENYANG INST OF AUTOMATION - CHINESE ACAD OF SCI
View PDF7 Cites 0 Cited by
  • Summary
  • Abstract
  • Description
  • Claims
  • Application Information

AI Technical Summary

Problems solved by technology

Therefore, with the improvement of project management level, the original regional boundaries cannot meet the needs of fine management

Method used


Image

  • Method for drawing dynamic control charts on basis of combination of calculation and statistics
  • Method for drawing dynamic control charts on basis of combination of calculation and statistics
  • Method for drawing dynamic control charts on basis of combination of calculation and statistics

Examples


Embodiment Construction

[0059] The present invention will be further described in detail below in conjunction with the accompanying drawings and embodiments.

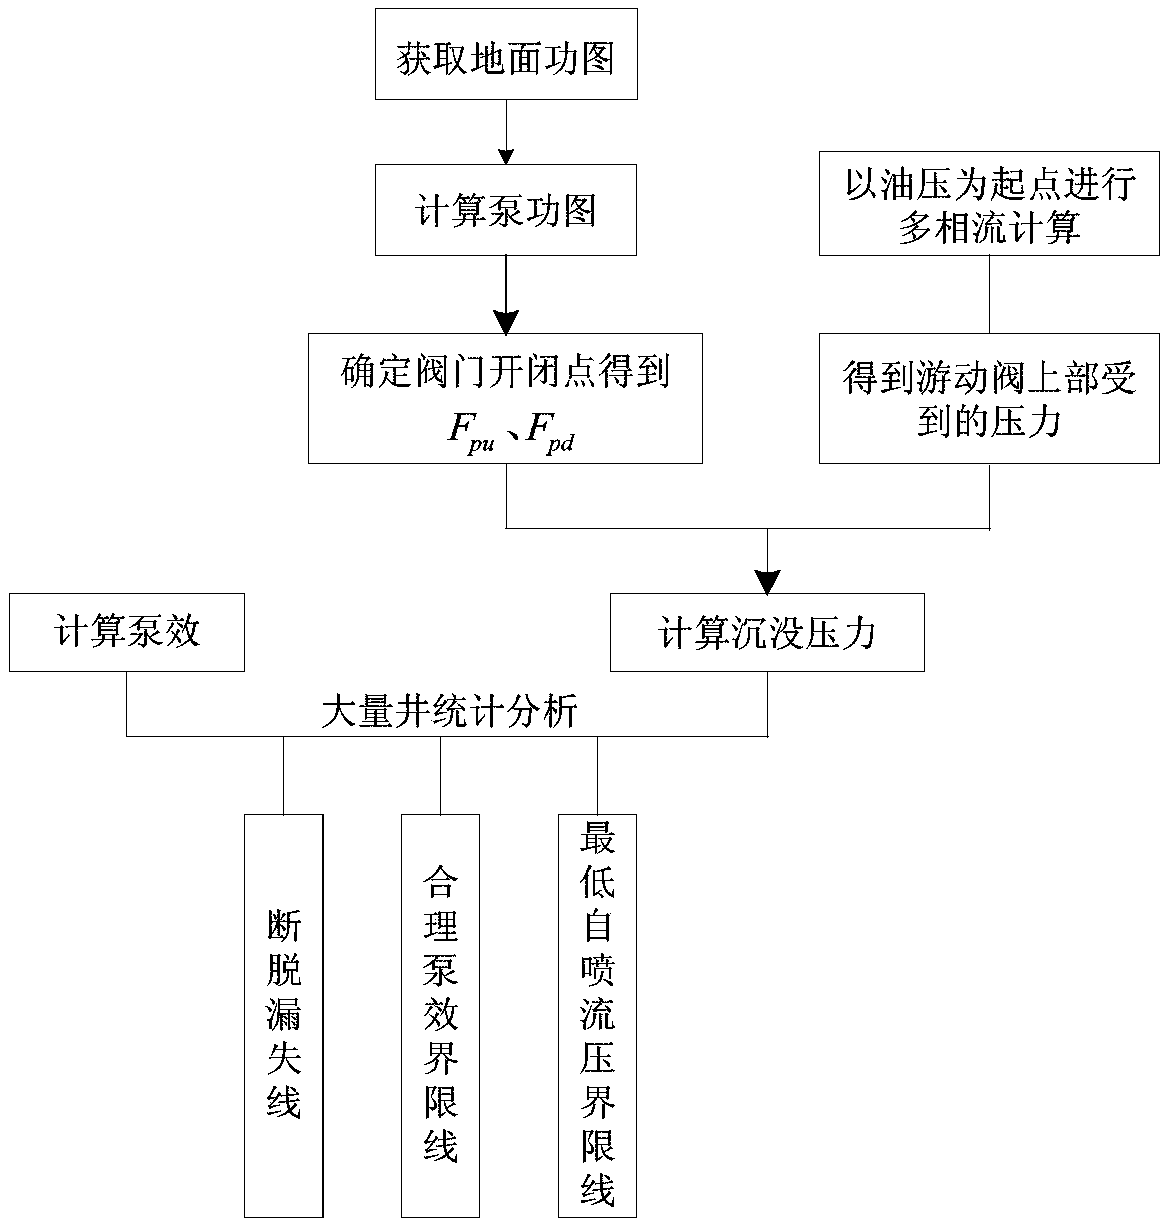
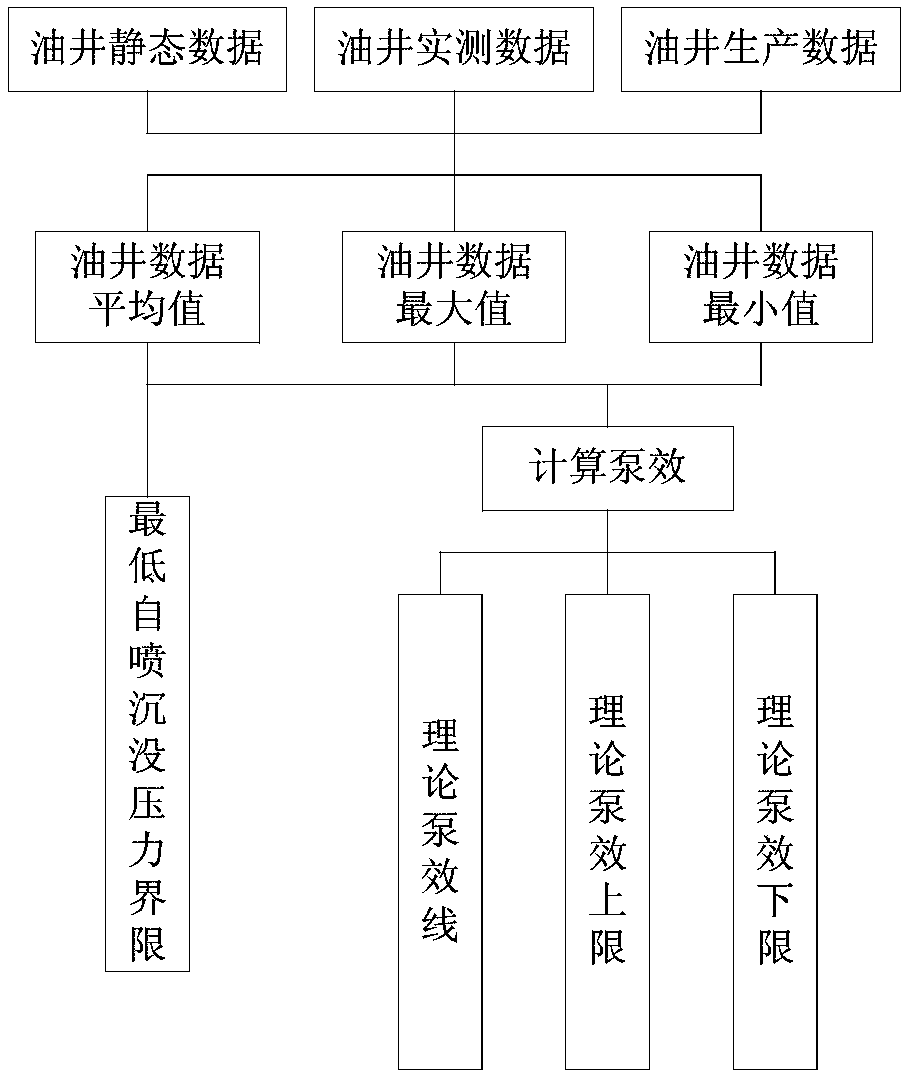
[0060] like figure 1 , figure 2 As shown, a method based on the combination of calculation and statistics to draw a dynamic control chart is based on the specific production data of the oil well such as pumping depth and water content of the oil well, and calculates the theoretical pump efficiency line, upper limit of theoretical pump efficiency, lower limit of theoretical pump efficiency and Liquid supply capacity limit line. Then, in a statistical way, by calculating the degree of submergence and pump efficiency, respectively determine the line of rod breakage leakage, the limit line of reasonable pump efficiency, and the limit line of the minimum self-spray flow pressure.

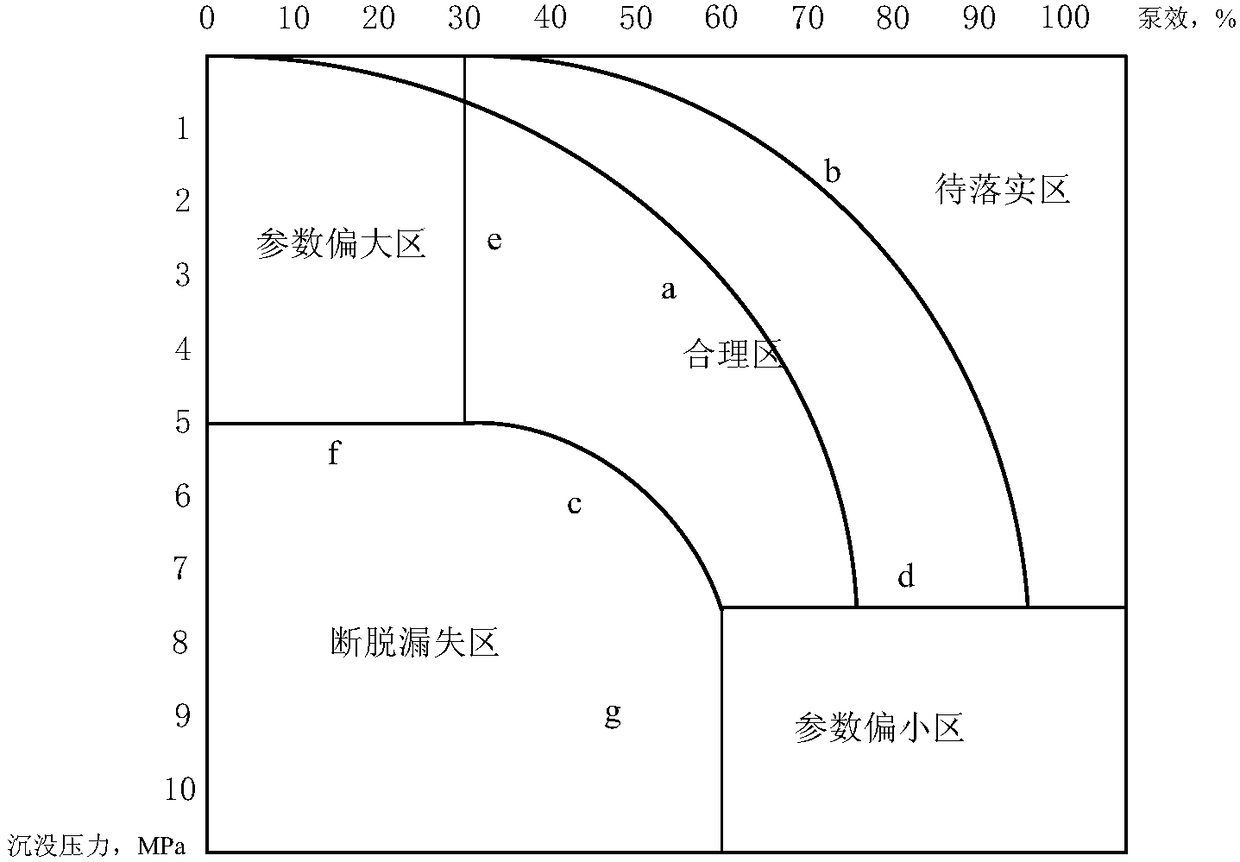
[0061] The lower limit e-line of the pump efficiency, the f-line of the liquid supply capacity limit and the g-line of the leakage loss limit in the reasonable area ...


PUM


Abstract

The invention relates to a method for drawing dynamic control charts on the basis of the combination of calculation and statistics. Firstly, based on specific oil field production data such as the pump putting-in depths of oil wells and the water contents, in the calculation mode, the theoretical pump efficiency upper limit, the theoretical pump efficiency lower limit, the theoretical pump efficiency line and the lowest self-spraying sinking pressure limit of each dynamic control chart are determined. Then in the statistic mode, by calculating the sinking degree and the pump efficiency, the liquid supply capacity limit line, the rod breaking-off and dropping line and the reasonable pump efficiency limit line are determined. Through the method for drawing the dynamic control charts on the basis of the combination of calculation and statistics, according to different production conditions of different oil fields and the different oil wells, the limits of the dynamic control charts are more accurate, and the drawing accuracy of the dynamic control charts is higher; and on the other hand, the dynamic control charts drawn by the method can be redrawn regularly, real-time renewing of thedynamic control charts can be ensured, the production condition of each well can be grasped in real time, the work system is optimized, and the oil pumping machine management level is increased.

Description

technical field [0001] The invention relates to the technical field of oilfield dynamic control diagram drawing, in particular to a method for drawing dynamic control diagram based on the combination of calculation and statistics. Background technique [0002] The dynamic control chart of the pumping well is a tool and means for the macroscopic management of the pumping well. It directly reflects the coordination relationship between the supply and drainage of the pumping well. The map is mainly divided into the following areas: large parameter area, missing area, reasonable area, small parameter area and pending implementation area. In terms of specific parameters, it is the coordinated relationship between the submerged pressure of the formation and the pump efficiency of the pumping well, and is widely used in the production management and program design of the pumping well. [0003] At present, the dynamic control map of pumping wells is drawn in units of teams. This dr...

Claims


Application Information

Patent Timeline
Patent Type & Authority Applications(China)
IPC IPC(8): E21B43/12
CPCE21B43/121
Inventor 于海斌曾鹏尚文利郑东梁李世超
Owner SHENYANG INST OF AUTOMATION - CHINESE ACAD OF SCI
Why Eureka
Try Eureka