Visual comparison analysis method and system for multi-region MRL standards

A multi-regional, standard technology, applied in the fields of information visualization and food safety, which can solve the problems of not giving the maximum amount of spinach, reducing the readability of the visualization scheme, and complex hierarchical structure.

Active Publication Date: 2018-07-13
BEIJING TECHNOLOGY AND BUSINESS UNIVERSITY
View PDF4 Cites 6 Cited by
  • Summary
  • Abstract
  • Description
  • Claims
  • Application Information

AI Technical Summary

Problems solved by technology

[0006] (4) There are differences in the maximum residue limits of the same pesticide in the same agricultural products in each country or regional organization. For example, the limit value of diazinon pesticide in spinach is 0.01mg/kg in EUR, 0.1mg/kg in Japan, and 0.1mg/kg in China. 0.5mg/kg in mainland China, 0.5mg/kg in CAC, 0.7mg/kg in the United States, and no maximum limit for this pesticide residue in spinach is given in Hong Kong, China
[0007] Due to the multi-regional MRL standard data has the characteristics of multiple dimensions, discrete distribution of attribute values, and complex hierarchical structure, it is not suitable to use different visual coding methods to express different attributes. First,

Method used


Image

  • Visual comparison analysis method and system for multi-region MRL standards
  • Visual comparison analysis method and system for multi-region MRL standards
  • Visual comparison analysis method and system for multi-region MRL standards

Examples


Embodiment Construction

[0059] Below in conjunction with accompanying drawing, further describe the present invention through embodiment, but do not limit the scope of the present invention in any way.

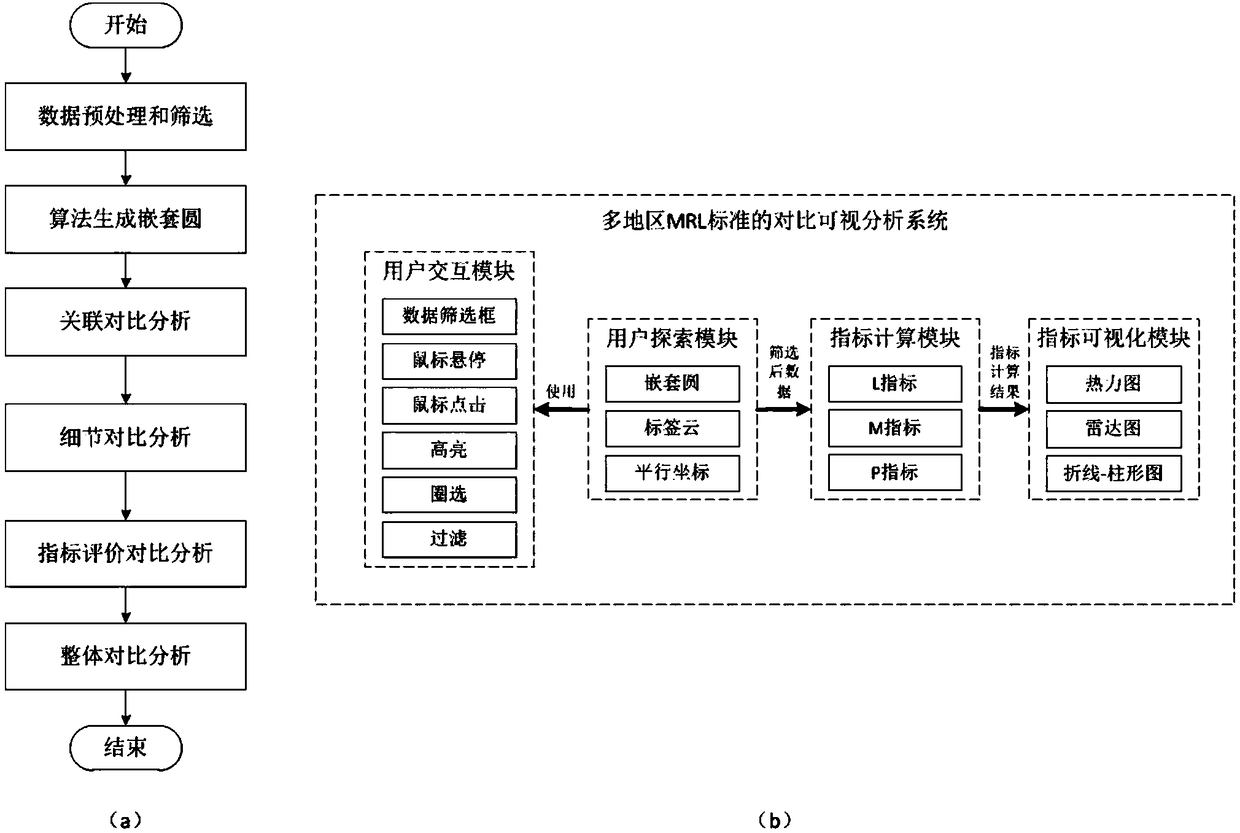
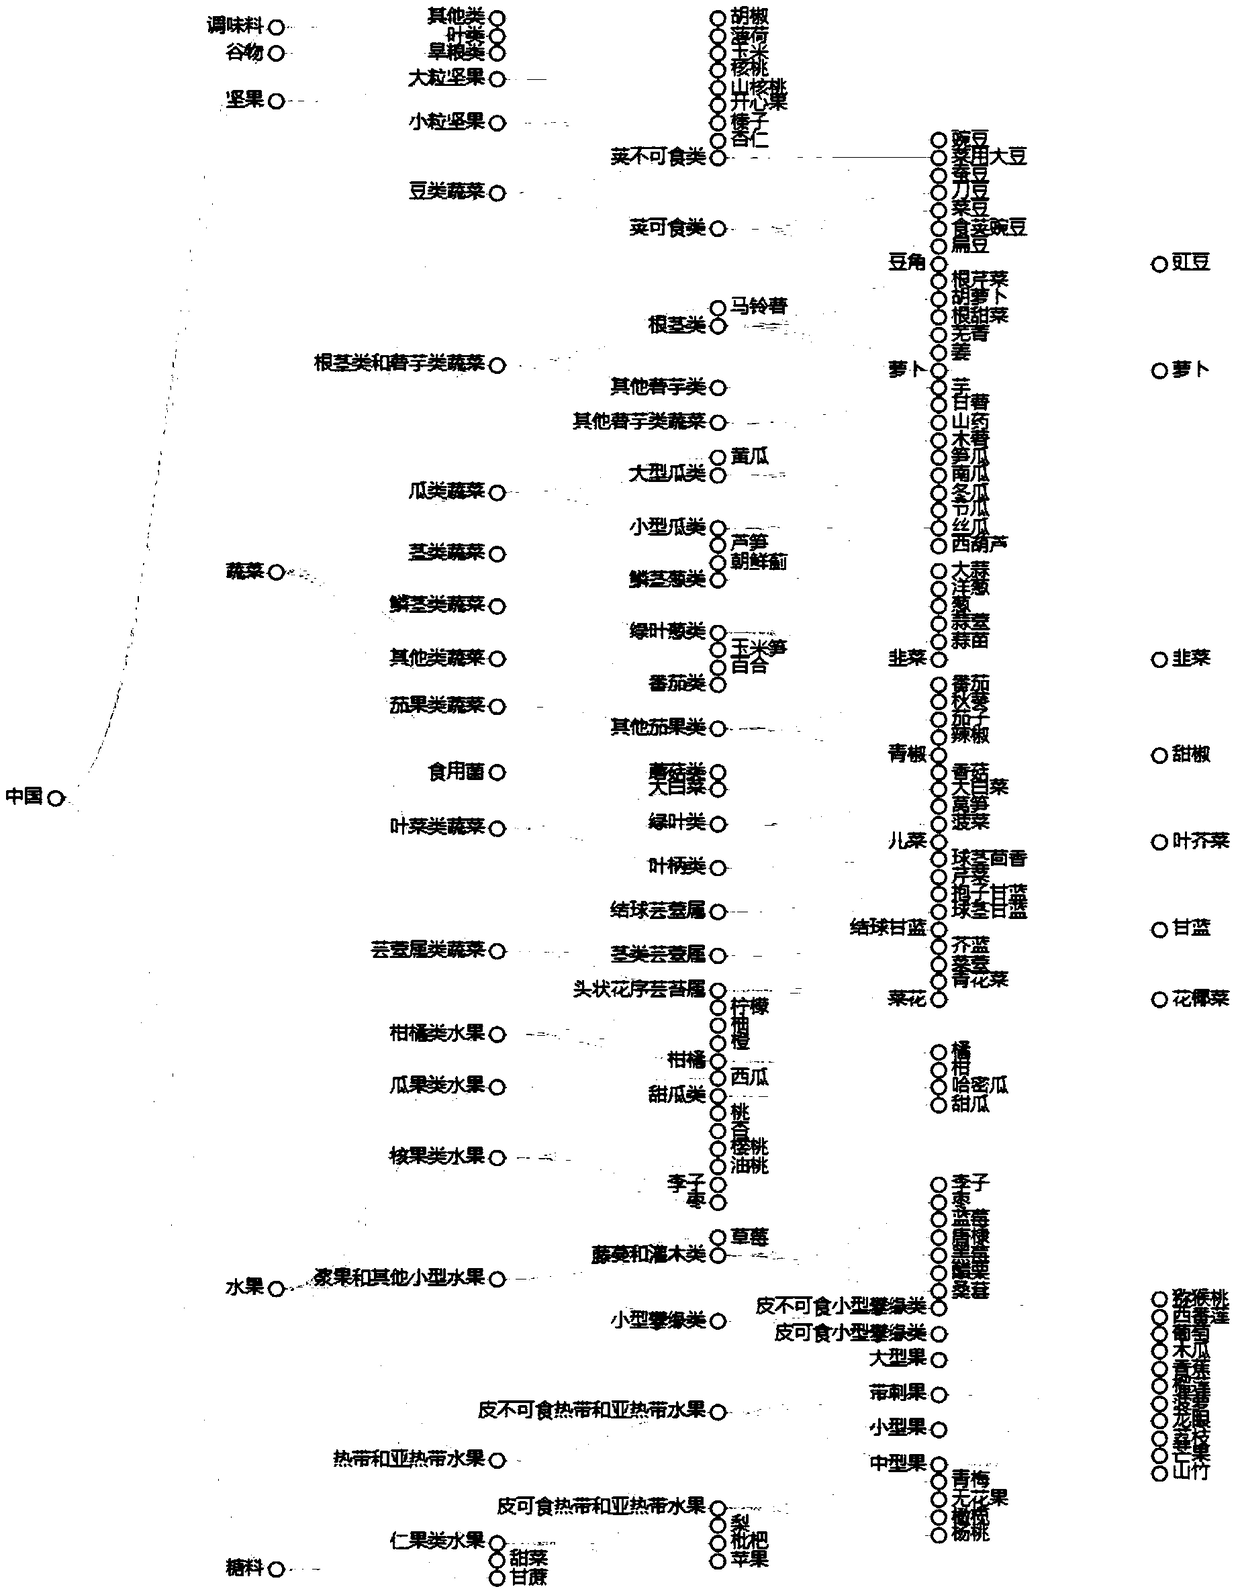
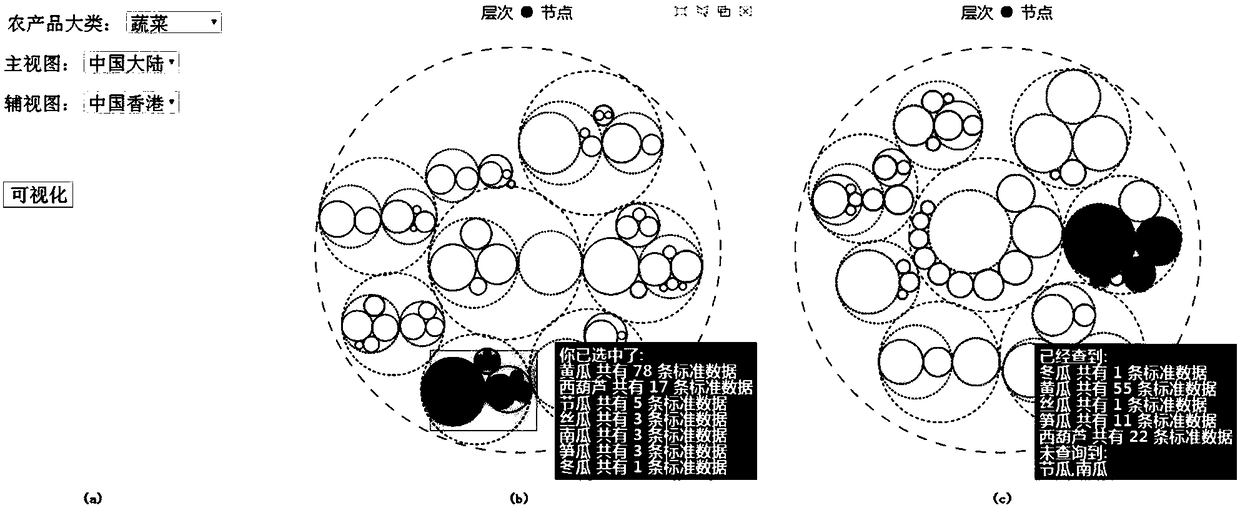
[0060] The invention provides a comparative and visual analysis method and system of MRL standards in multiple regions. Combining interactive technology to conduct correlation comparative analysis, detailed comparative analysis, index comparative analysis and overall comparative analysis. The comparative visual analysis system of multi-regional MRL standards combines nested circles representing hierarchical structures, parallel coordinates and radar charts displaying multi-dimensional data, and tag clouds representing attribute values, polyline-column graphs, and linkage technology for comparative visualization At the same time, interactive technology is provided to help users drill down to dig deep knowledge. It can perform multi-dimensional and hierarchical data comparison and visual analysis for ...


PUM


Abstract

The invention discloses a visual comparison analysis method and system for multi-region maximum residue limit (MRL) standards. An agricultural product classification tree is constructed by adopting MRL standard data from top to bottom, and correlation comparison analysis, detail comparison analysis, index evaluation comparison analysis and overall comparison analysis are achieved in combination with an interactive technology. The system comprises a user interaction module, a user exploration module, an index calculation module and an index visualization module. LPM indexes include a classification hierarchy number L of agricultural products, a related pesticide number P and a record number M of pesticide limit values in a data set, the LPM indexes are quantitatively calculated through weighting, and the accuracy of comparison analysis is improved; by adopting a nested circle, a radar chart, a parallel coordinate and tag cloud, a polyline-column chart and the interactive technology, thedifference in the strict degree of determining the classification conditions of the agricultural products and the coverage range of the MRL standards of the agricultural products at different regionsis quickly discovered. The visual comparison analysis method and system for the multi-region maximum residue limit (MRL) standards can also be used for visual comparison analysis in other applicationfields of multi-dimensional hierarchical data.

Description

technical field [0001] The invention belongs to the technical fields of information visualization and food safety, and mainly relates to a comparative visual analysis method and system of multi-country, multi-region and multi-organization (hereinafter referred to as multi-region) MRL standards. Background technique [0002] The maximum limit of pesticide residues (Maximum Residue Limits, referred to as MRL) refers to the legal maximum allowable concentration of pesticide residues in certain agricultural products, calculated in milligrams of pesticide residues per kilogram of agricultural products (mg / kg). An MRL standard record refers to the maximum limit value of a pesticide in a certain agricultural product. To a certain extent, the MRL standard reflects the level of management of pesticide use in a country, region, or organization. Mainland China, Hong Kong, the United States, Japan, the European Union (hereinafter referred to as EUR) and the International Codex Alimenta...

Claims


Application Information

Patent Timeline
IPC IPC(8): G06F17/30
CPCG06F16/2246G06F16/2282G06F16/248G06F16/283
Inventor 陈谊吕程董禹
Owner BEIJING TECHNOLOGY AND BUSINESS UNIVERSITY
Why Eureka
Try Eureka