

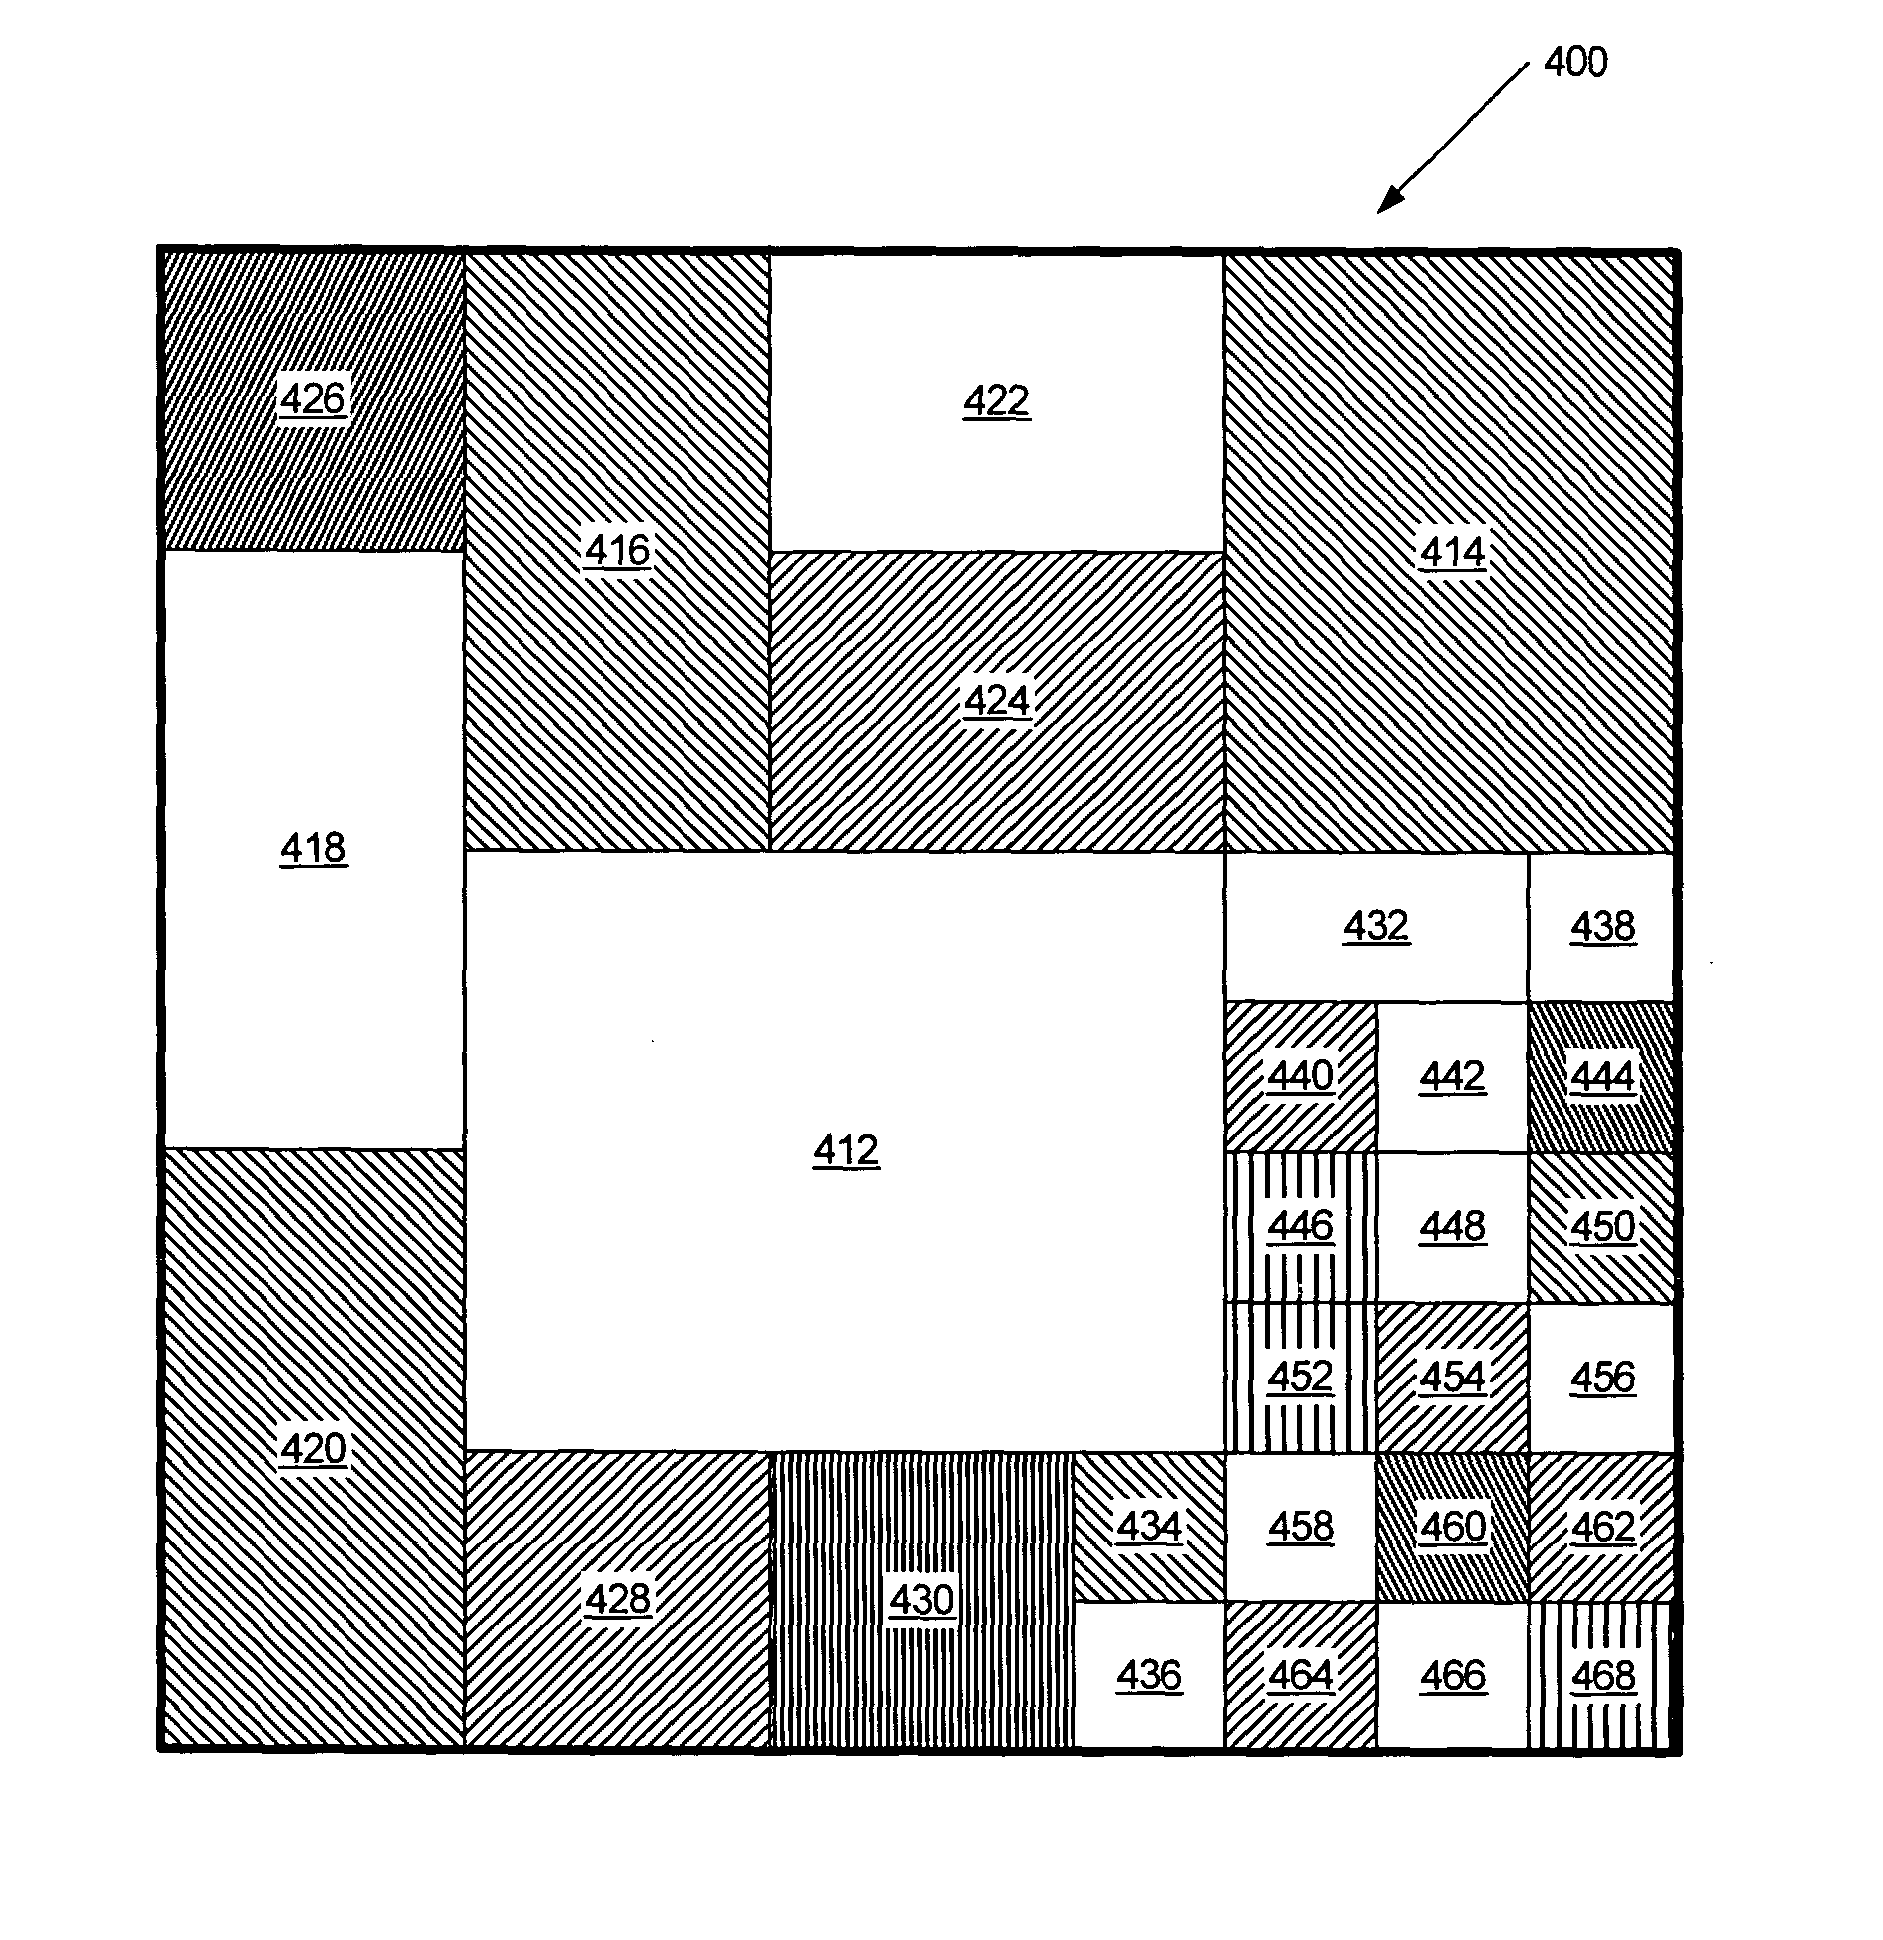
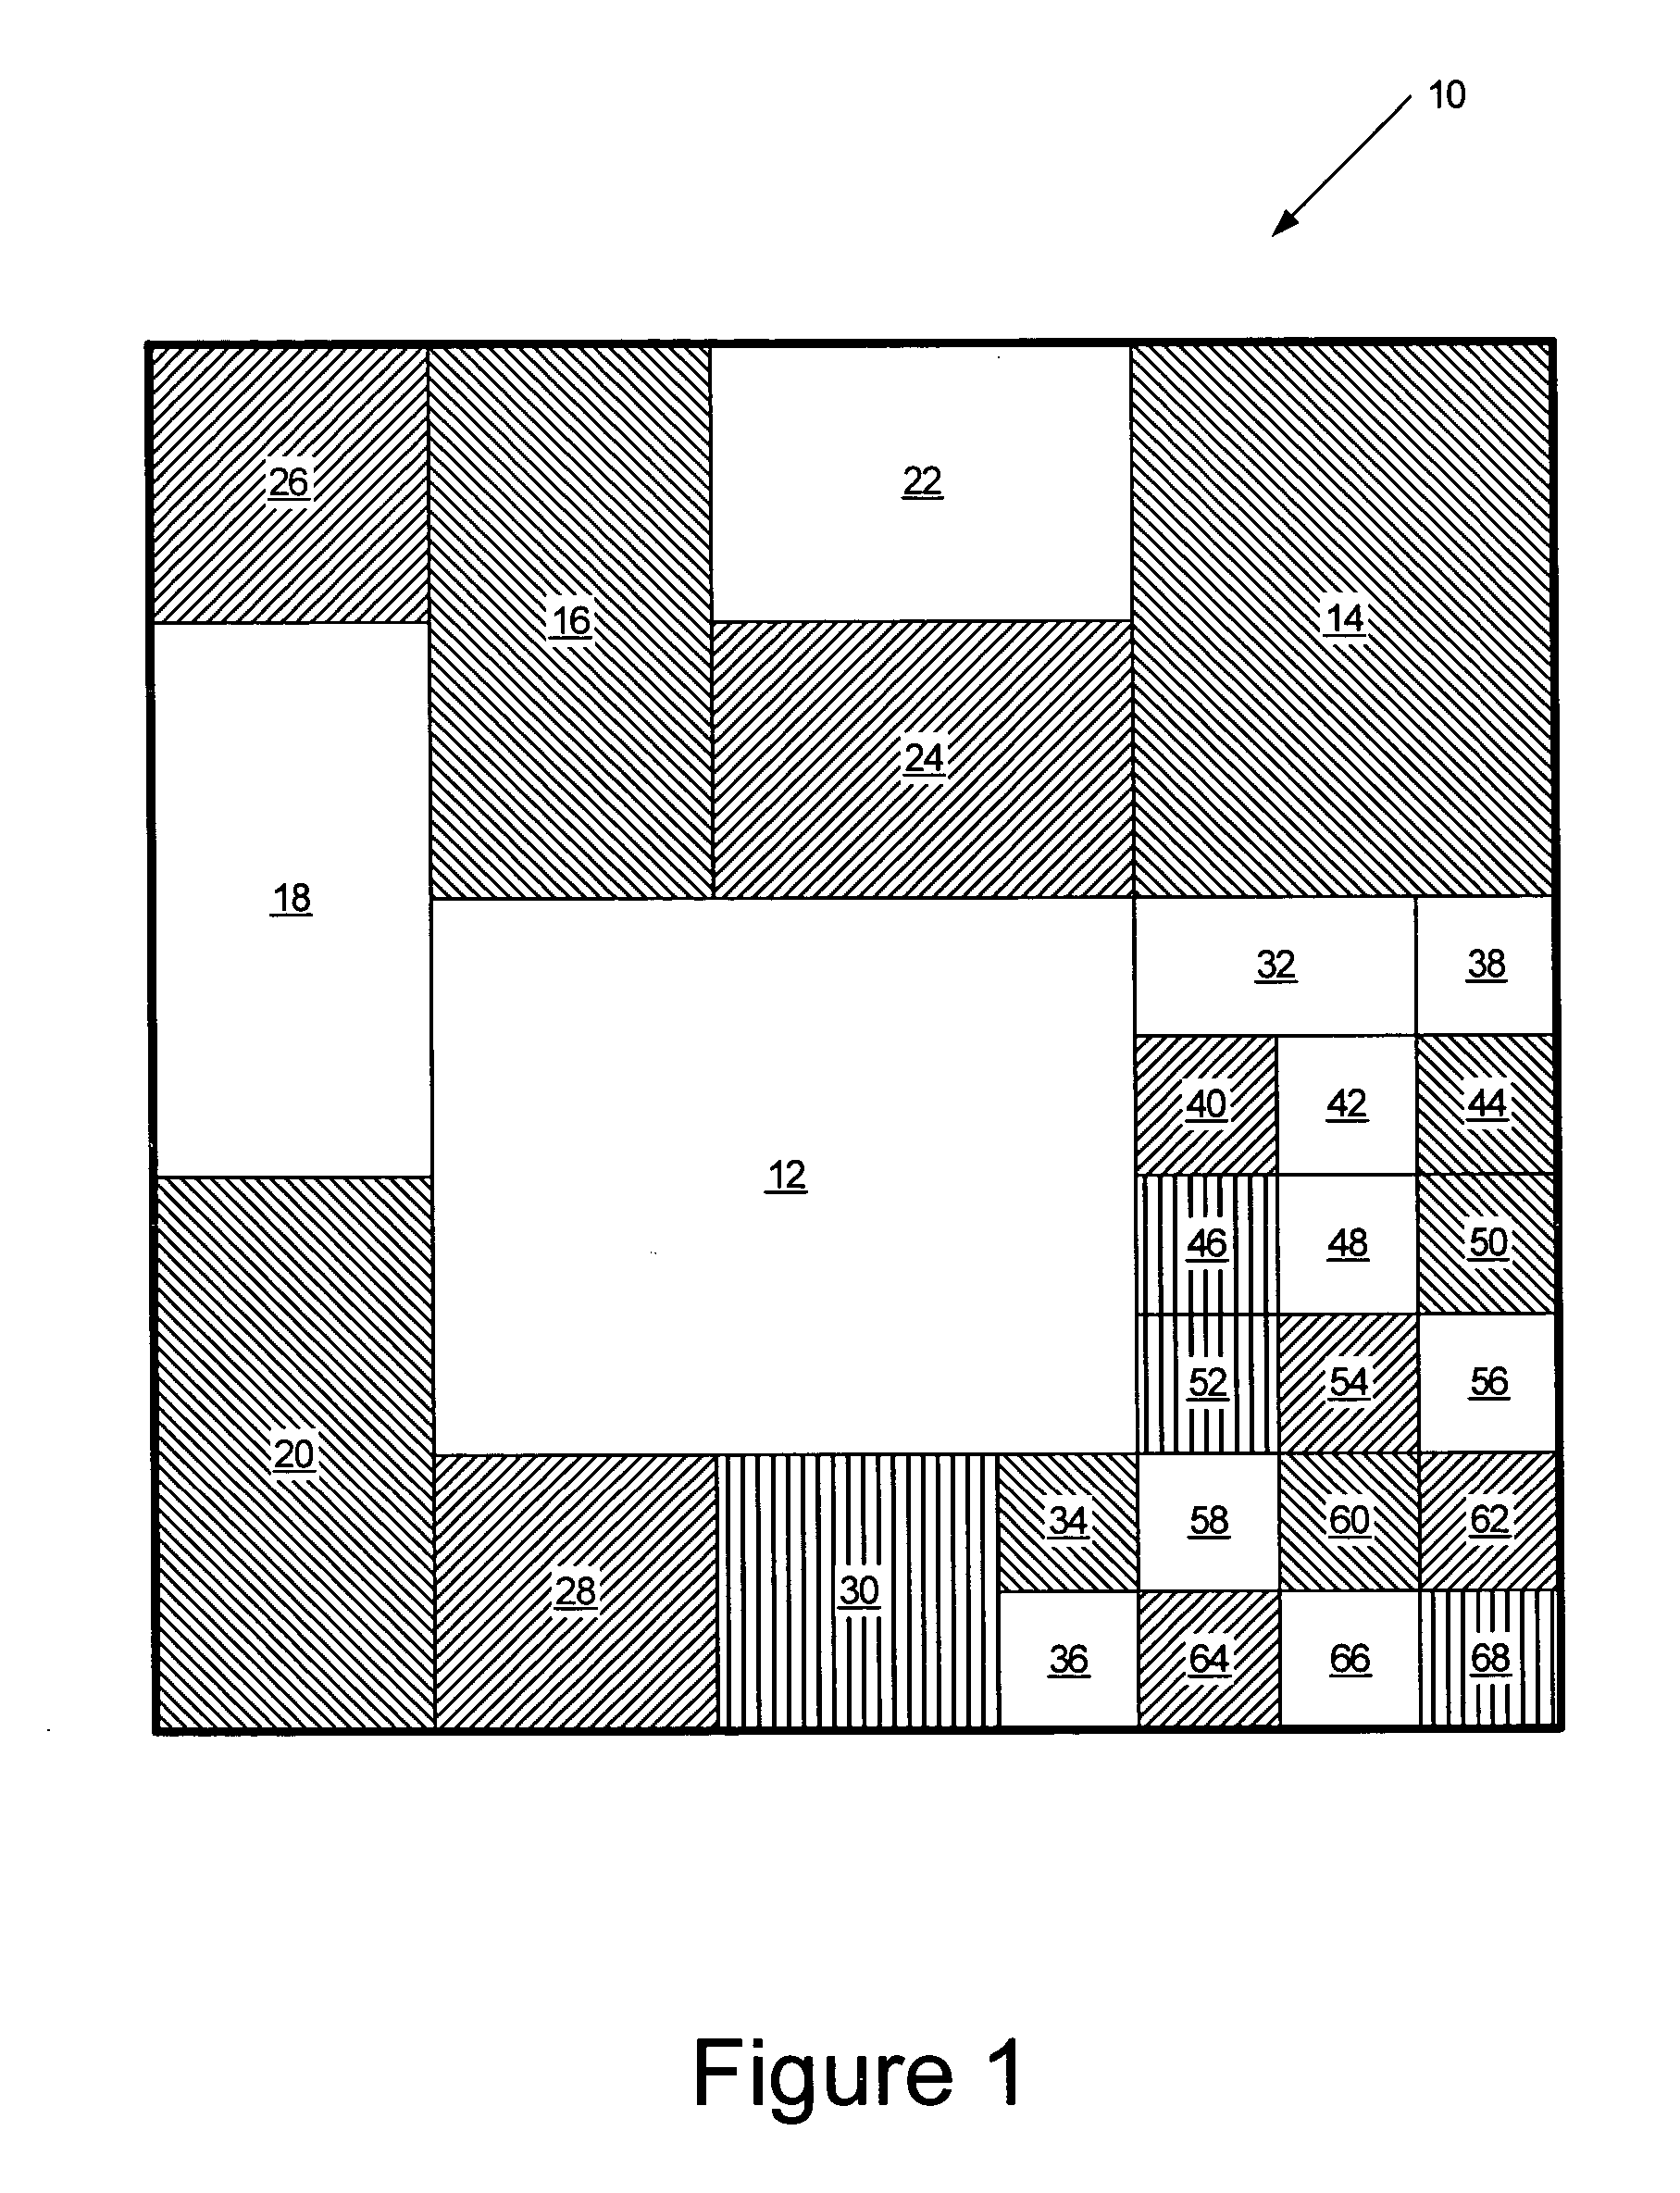
Methods, systems and computer program products for use of color saturation to highlight items in a tree map visualization
a tree map and color saturation technology, applied in the field of display devices, can solve the problems of large display space, affecting and the inability of human operators to adequately analyze data, etc., and achieve the effect of increasing the color saturation of bounding boxes
- Summary
- Abstract
- Description
- Claims
- Application Information
AI Technical Summary
Benefits of technology
Problems solved by technology
Method used
Image

Examples
Embodiment Construction
[0019] The present invention now will be described more fully hereinafter with reference to the accompanying drawings, in which illustrative embodiments of the invention are shown. This invention may, however, be embodied in many different forms and should not be construed as limited to the embodiments set forth herein; rather, these embodiments are provided so that this disclosure will be thorough and complete, and will fully convey the scope of the invention to those skilled in the art. Like numbers refer to like elements throughout.
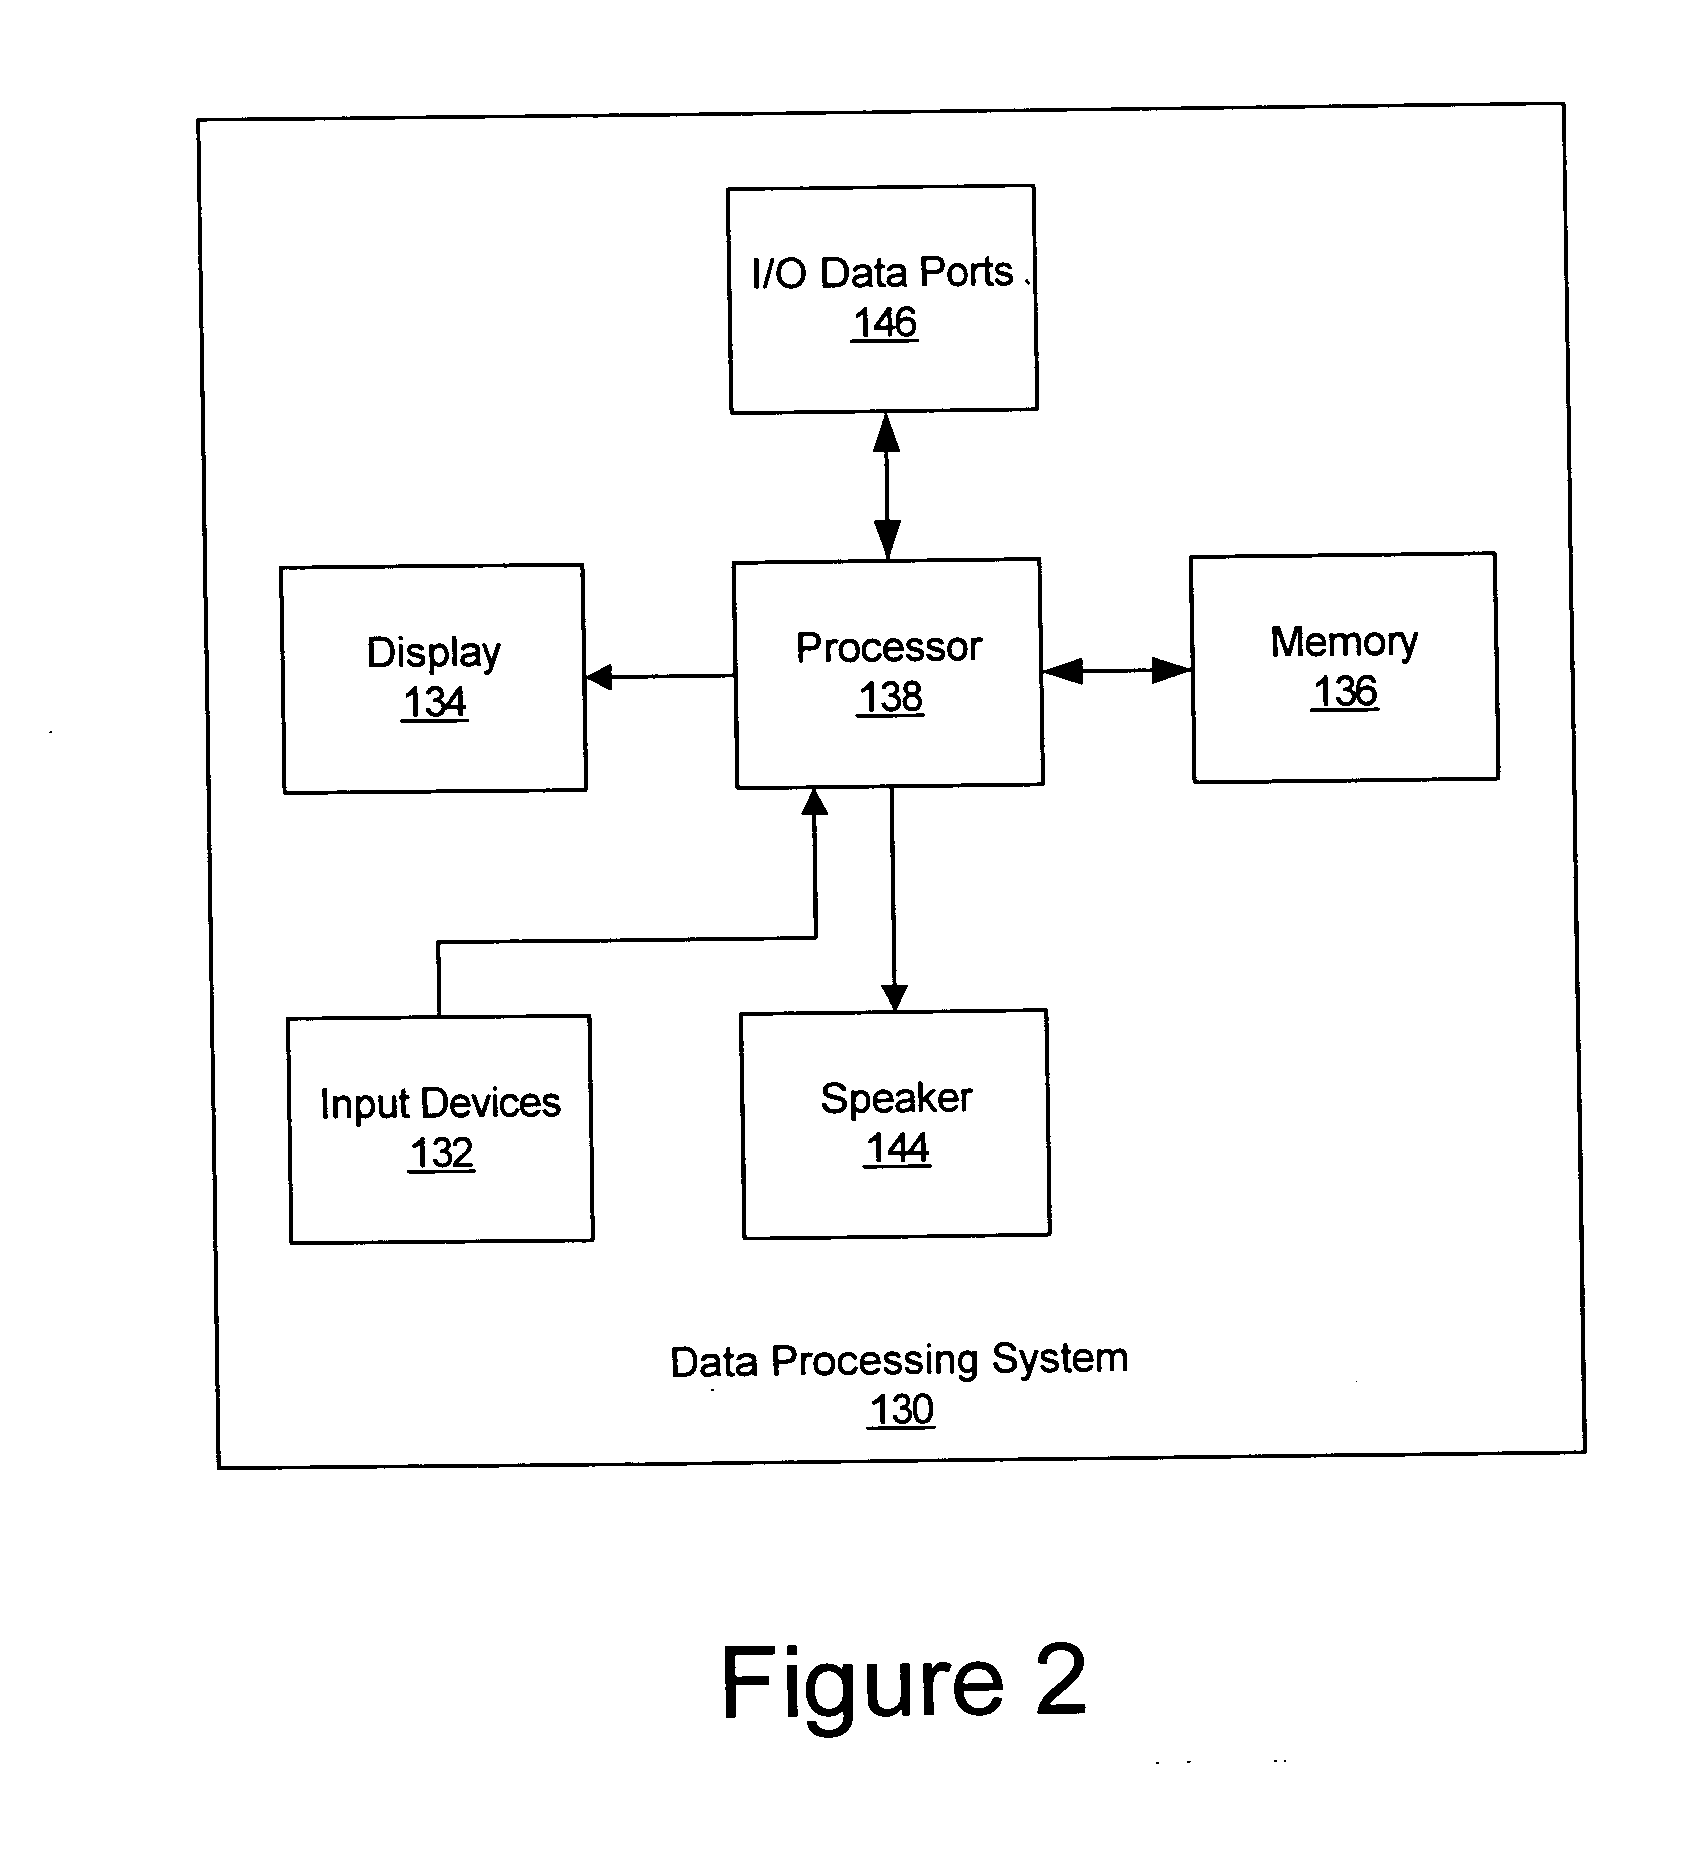
[0020] As will be appreciated by one of skill in the art, the present invention may be embodied as a method, data processing system, or computer program product. Accordingly, the present invention may take the form of an entirely hardware embodiment, an entirely software embodiment or an embodiment combining software and hardware aspects all generally referred to herein as a “circuit” or “module.” Furthermore, the present invention may take the form o...
PUM
 Abstract
Description
Claims
Application Information