
Method for classifying rock mass quality through normal distribution fitting rock mass wave velocities
A technology of normal distribution and rock mass quality, which is applied to the analysis of solids using sound waves/ultrasonic waves/infrasonic waves, can solve problems such as poor pertinence, inaccurate grading standard values, and unclear calculation methods in the actual situation of the work area, and achieve calculation Quick, easy to popularize, improve the effect of work efficiency
- Summary
- Abstract
- Description
- Claims
- Application Information
AI Technical Summary
Problems solved by technology
Method used
Image

Examples
Embodiment Construction
[0035] The technical solutions in the present invention will be clearly and completely described below in conjunction with the accompanying drawings in the present invention.
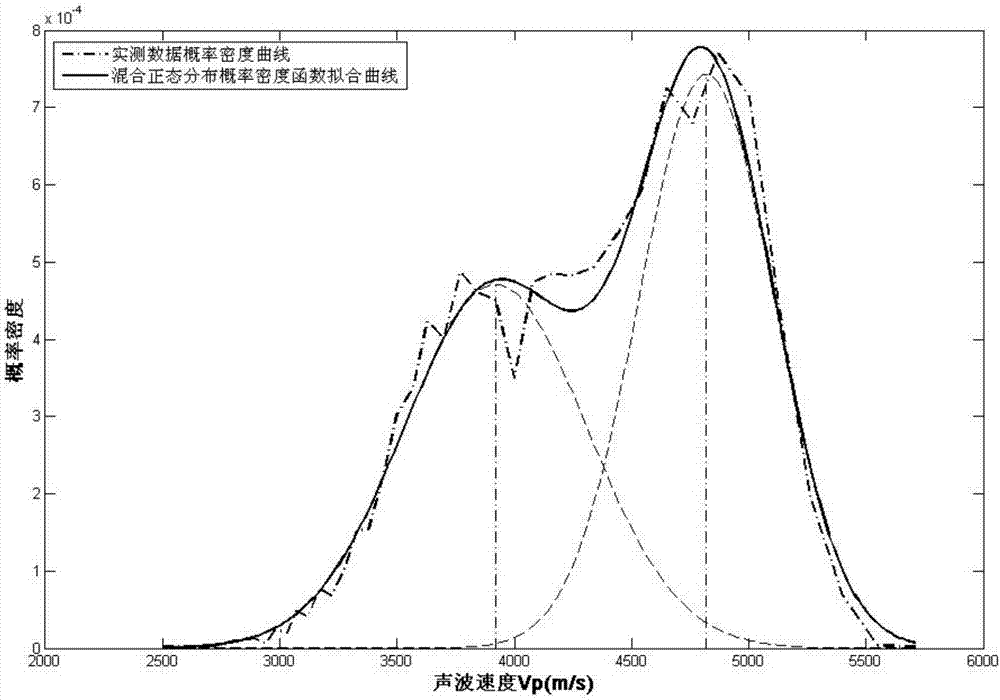
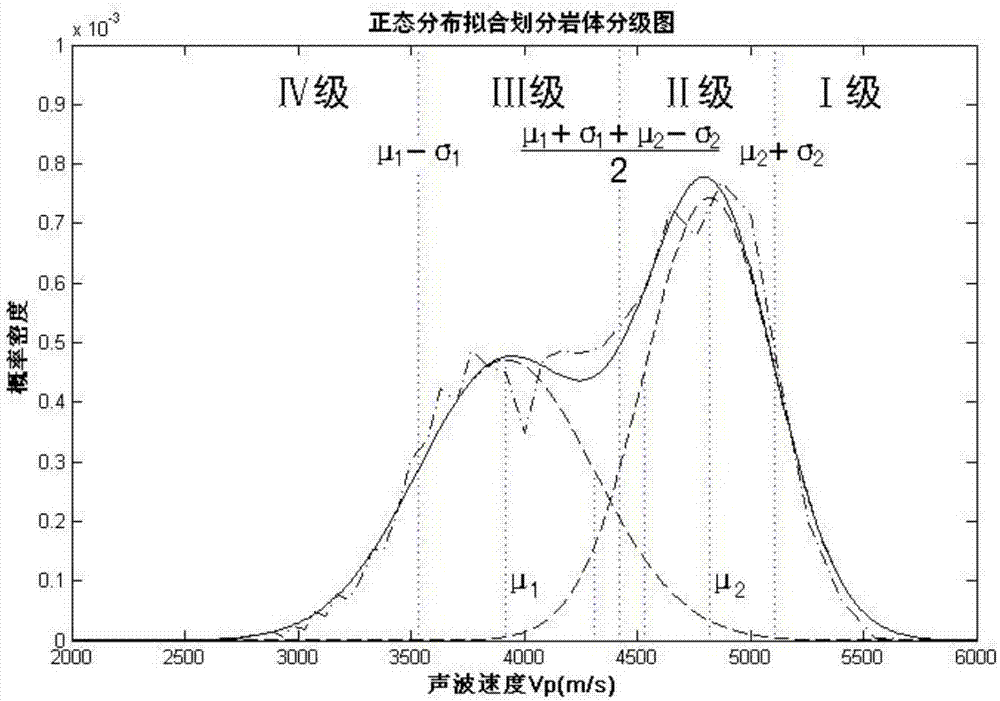
[0036] The present invention provides a method for classifying rock mass quality by fitting rock mass wave velocity with normal distribution, comprising the following steps:
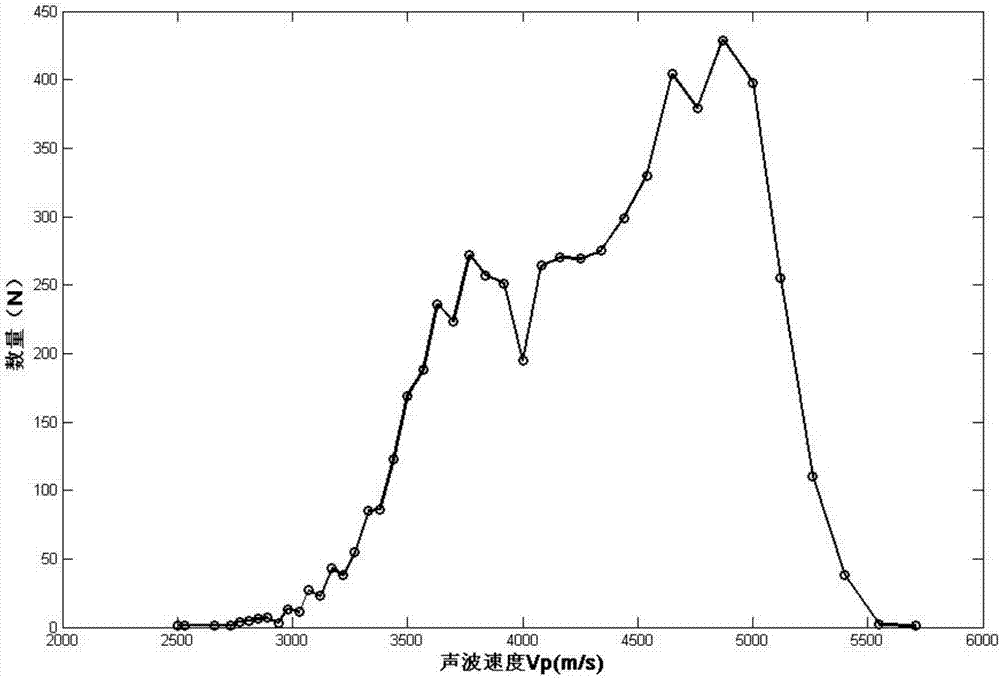
[0037] Step 1. Sort the measured rock mass wave velocity data from small to large, and count the number of each wave velocity data, as shown in Table 1, and draw the rock mass wave velocity value statistical diagram, see figure 1 .
[0038] Table 1 Statistical table of wave velocity values of rock mass
[0039] Wave speed (m / s) 2500 2530 2660 2730 2770 2810 2850 2890 2940 2980 3030 3070 amount) 1 1 1 1 4 5 6 7 3 13 11 27 Wave speed (m / s) 3120 3170 3220 3270 3330 3380 3440 3500 3570 3630 3700 3770 amount) 23 43 38 55 85 86 123 169 188 236 223 272 Wave ...
PUM
 Abstract
Description
Claims
Application Information