

Time axis display method and device for displaying real-time network performance data
A real-time network and network performance technology, applied in the direction of data exchange network, digital transmission system, electrical components, etc., can solve the problems such as the inability to realize the time axis display
- Summary
- Abstract
- Description
- Claims
- Application Information
AI Technical Summary
Problems solved by technology
Method used
Image


Examples
Embodiment Construction
[0024] The specific implementation manners of the present invention will be described in detail below in conjunction with the accompanying drawings.
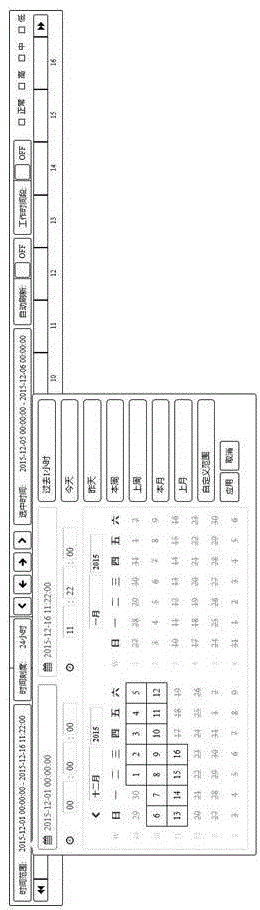
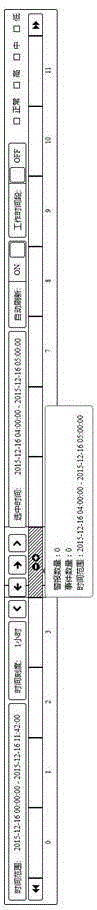
[0025] The invention discloses a time axis display method of real-time network performance data, which specifically includes the following steps: Step 1, the probe (a server that collects and stores network communication data) records with a unit time scale (minutes, hours, days) The network performance data; Step 2, define a time scale (minute, hour, day) and send a query request to the server, the server will calculate the data of the time period that needs to be returned based on the queried time scale (such as the query scale is minutes, Returns the latest 60 ticks based on the current server time, that is, the data of the last hour. If the query tick is hourly, the server returns the latest 24 ticks based on the server's current time, that is, the data of the last 1 day. For example, query ticks day, the server returns the ...
PUM
 Abstract
Description
Claims
Application Information