Urban road network jam feature description analysis method based on data visualization

A technology of urban road network and analysis method, which is applied in the field of description and analysis of urban road network congestion characteristics, and can solve the problems of lack of traffic data mining and in-depth analysis

Active Publication Date: 2017-02-08
JIANGSU ZHITONG TRANSPORTATION TECH
View PDF5 Cites 39 Cited by
  • Summary
  • Abstract
  • Description
  • Claims
  • Application Information

AI Technical Summary

Problems solved by technology

[0005] Most of the existing traffic data visualization is limited to the data display level, fails to make full use of the great a

Method used


Image

  • Urban road network jam feature description analysis method based on data visualization

Examples


Embodiment

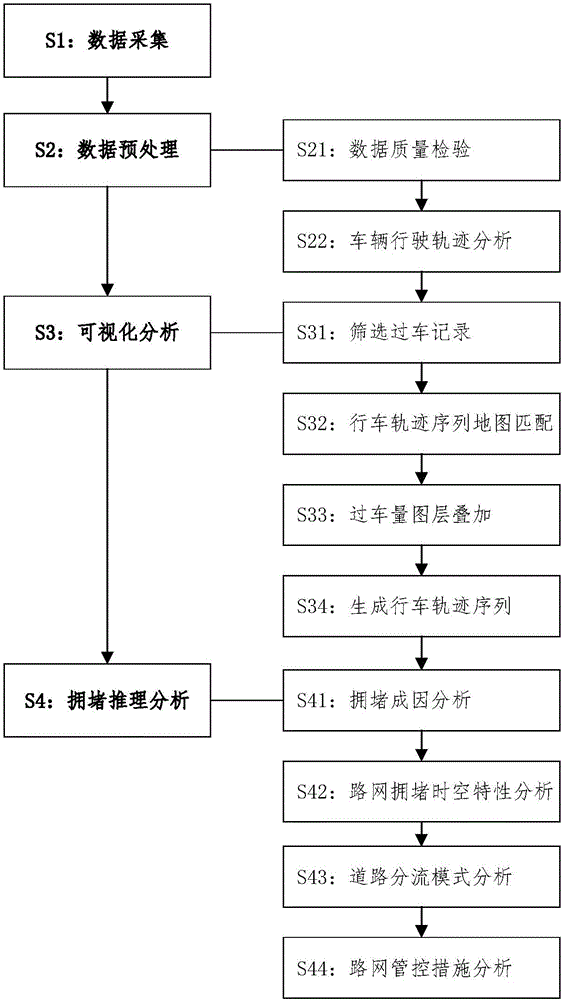
[0038] A method for describing and analyzing urban road network congestion characteristics based on data visualization, such as figure 1 , including the following steps:

[0039]S1. Data collection: access the smart checkpoint detection data at each intersection of the road network from the external interface, including equipment number, vehicle detection time, and license plate number; at the same time, collect static information on the road network, including road network topology, road section length and Lane number, lane turning number of intersection entrance lane.

[0040] S2. Data preprocessing: including data quality inspection and vehicle trajectory analysis. By performing data quality inspection on the original detection data collected by the smart bayonet, valid and complete bayonet detection data is obtained; vehicle trajectory sequences are generated from the bayonet detection data T.

[0041] S21. Data quality inspection: check the validity and completeness of ...


PUM


Abstract

The present invention provides an urban road network jam feature description analysis method based on data visualization. Generating a vehicle driving track sequence T aiming at the collected intelligent card port original detection data; performing visualization description analysis of the road network traffic operation condition based on the vehicle driving track sequence T, generating vehicle passing track-road section matching condition to perform statistics of the number of vehicle passing at the road section and overlap the display layers of the number of the vehicle passing on the electronic map, and performing road network jam state basic description analysis; and realizing the road network jam and traffic operation state analysis through the interaction operation. The urban road network jam feature description analysis method based on data visualization can allow the traffic managers to obtain clear traffic management control thinking through the road network jam time-space features and the described analysis of the road shunt features so as to provide basis for the research and the enforcement of the traffic signal control strategy and the path induction strategy.

Description

technical field [0001] The invention relates to a method for describing and analyzing urban road network congestion characteristics based on data visualization. Background technique [0002] With the advancement of urbanization and the steady development of the social economy, the contradiction between supply and demand in the urban transportation system has become increasingly intensified. The problem of traffic congestion has become a traffic management problem in large and medium-sized cities in China in recent years. A large number of intelligent traffic supervision systems have gradually been promoted. Massive traffic operation data are displayed in a visual and interactive manner and applied to traffic supervision fields such as dynamic monitoring of traffic operation and traffic signal control. [0003] The early applications of traffic data visualization mainly focused on the visual description of traffic flow. Lines and arrows were used to visually explain the traff...

Claims


Application Information

Patent Timeline
IPC IPC(8): G08G1/01
CPCG08G1/0125
Inventor 李攀王晓东吕伟韬张韦华盛旺
Owner JIANGSU ZHITONG TRANSPORTATION TECH
Why Eureka
Try Eureka