A method for displaying large-scale multi-attribute stacked histograms in a limited space

A limited space, histogram technology, applied in the field of visualization, can solve the problems of column vision discontinuity, visual interference, and indistinguishable boundaries.

Active Publication Date: 2021-09-10
ZHEJIANG UNIV
View PDF8 Cites 0 Cited by
  • Summary
  • Abstract
  • Description
  • Claims
  • Application Information

AI Technical Summary

Problems solved by technology

The main difficulties are: 1) Due to excessive compression, the boundaries of each column are indistinguishable; 2) Columns of the same color (same numerical attribute) are visually discontinuous, causing serious visual disturbance and confusion

Method used


Image

  • A method for displaying large-scale multi-attribute stacked histograms in a limited space
  • A method for displaying large-scale multi-attribute stacked histograms in a limited space
  • A method for displaying large-scale multi-attribute stacked histograms in a limited space

Examples


Embodiment Construction

[0039] The purpose and effect of the present invention will become more obvious through an optimization case of a stacked histogram of multi-dimensional housing data and the accompanying drawings.

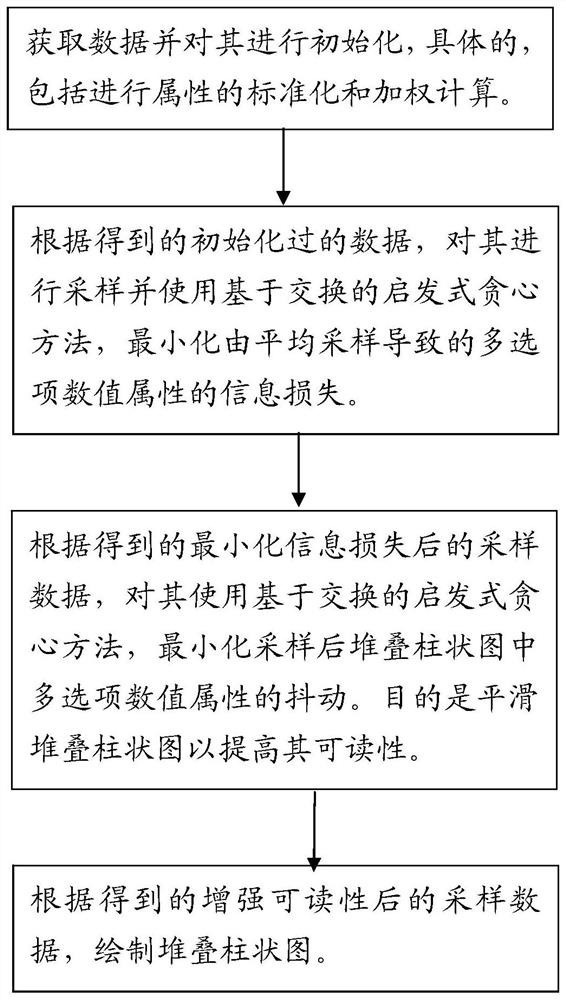
[0040] like figure 1 As shown, the method for displaying a large-scale multi-attribute stacked histogram in a limited space in this embodiment includes the following steps:

[0041] (1) Obtain massive multi-dimensional housing data and initialize it, including standardization and weighted calculation of attributes. The specific steps are as follows:

[0042] 1-1. In the data set, let n be the number of data options, and m be the number of data indicators. Each item of data contains attributes of multiple dimensions, for example: price per unit area c 1 , area c 2 , year of construction c 3, the number of bedrooms c 4 etc., uniformly standardize the attributes of each item of data to the [0, 1] interval.

[0043] Specifically, let c j_max is the maximum value of the jth indic...


PUM


Abstract

The invention discloses a method for displaying a large-scale multi-attribute stacked histogram in a limited space, which comprises the following steps: (1) acquiring data and initializing it; data, sample and use the exchange-based heuristic greedy method to minimize the information loss of the multi-option numerical attribute caused by the average sampling; (3) according to the sampled data obtained in step (2) after minimizing the information loss, use the method based on The heuristic greedy method of exchanging minimizes the jitter of the multi-option numerical attribute in the stacked histogram after sampling; (4) draws the stacked histogram according to the sampled data after the enhanced readability obtained in step (3); the present invention can help Users can better perceive the stacked histogram of large-scale multi-attribute data, and discover and analyze the data patterns contained in the visualization, which has the potential for wide application in related fields such as big data visualization and visual analysis.

Description

technical field [0001] The invention relates to the field of visualization technology, in particular to a method for displaying a large-scale multi-attribute stacked histogram in a limited space. Background technique [0002] A stacked column chart is a common form of visualization. Each row in the figure represents an option whose value is to be assessed. Each row is stacked by multiple columns whose colors represent different numerical attributes, and whose length represents the value of the corresponding attribute. The stacked column chart can visually display the data of each attribute contained in each option, showing the relationship between the individual and the whole. Stacked histograms are often used to compare the value of different options and at the same time compare the value of different attributes within an option. Compared with ordinary histograms, stacked histograms can show more dimensions of data. [0003] However, stacked histograms are gradually dif...

Claims


Application Information

Patent Timeline
Patent Type & Authority Patents(China)
IPC IPC(8): G06F16/26
Inventor 巫英才翁荻陈然邓紫坤
Owner ZHEJIANG UNIV
Why Eureka
Try Eureka