[0018]The present invention according to (1) comprises the storage means storing the graph generated based on the economic statistical data and the attribute information of the stored graph, so the economic statistical data can be supplied to the
client terminal as graph information easy to understand visually. Moreover, the present invention comprises the graph display
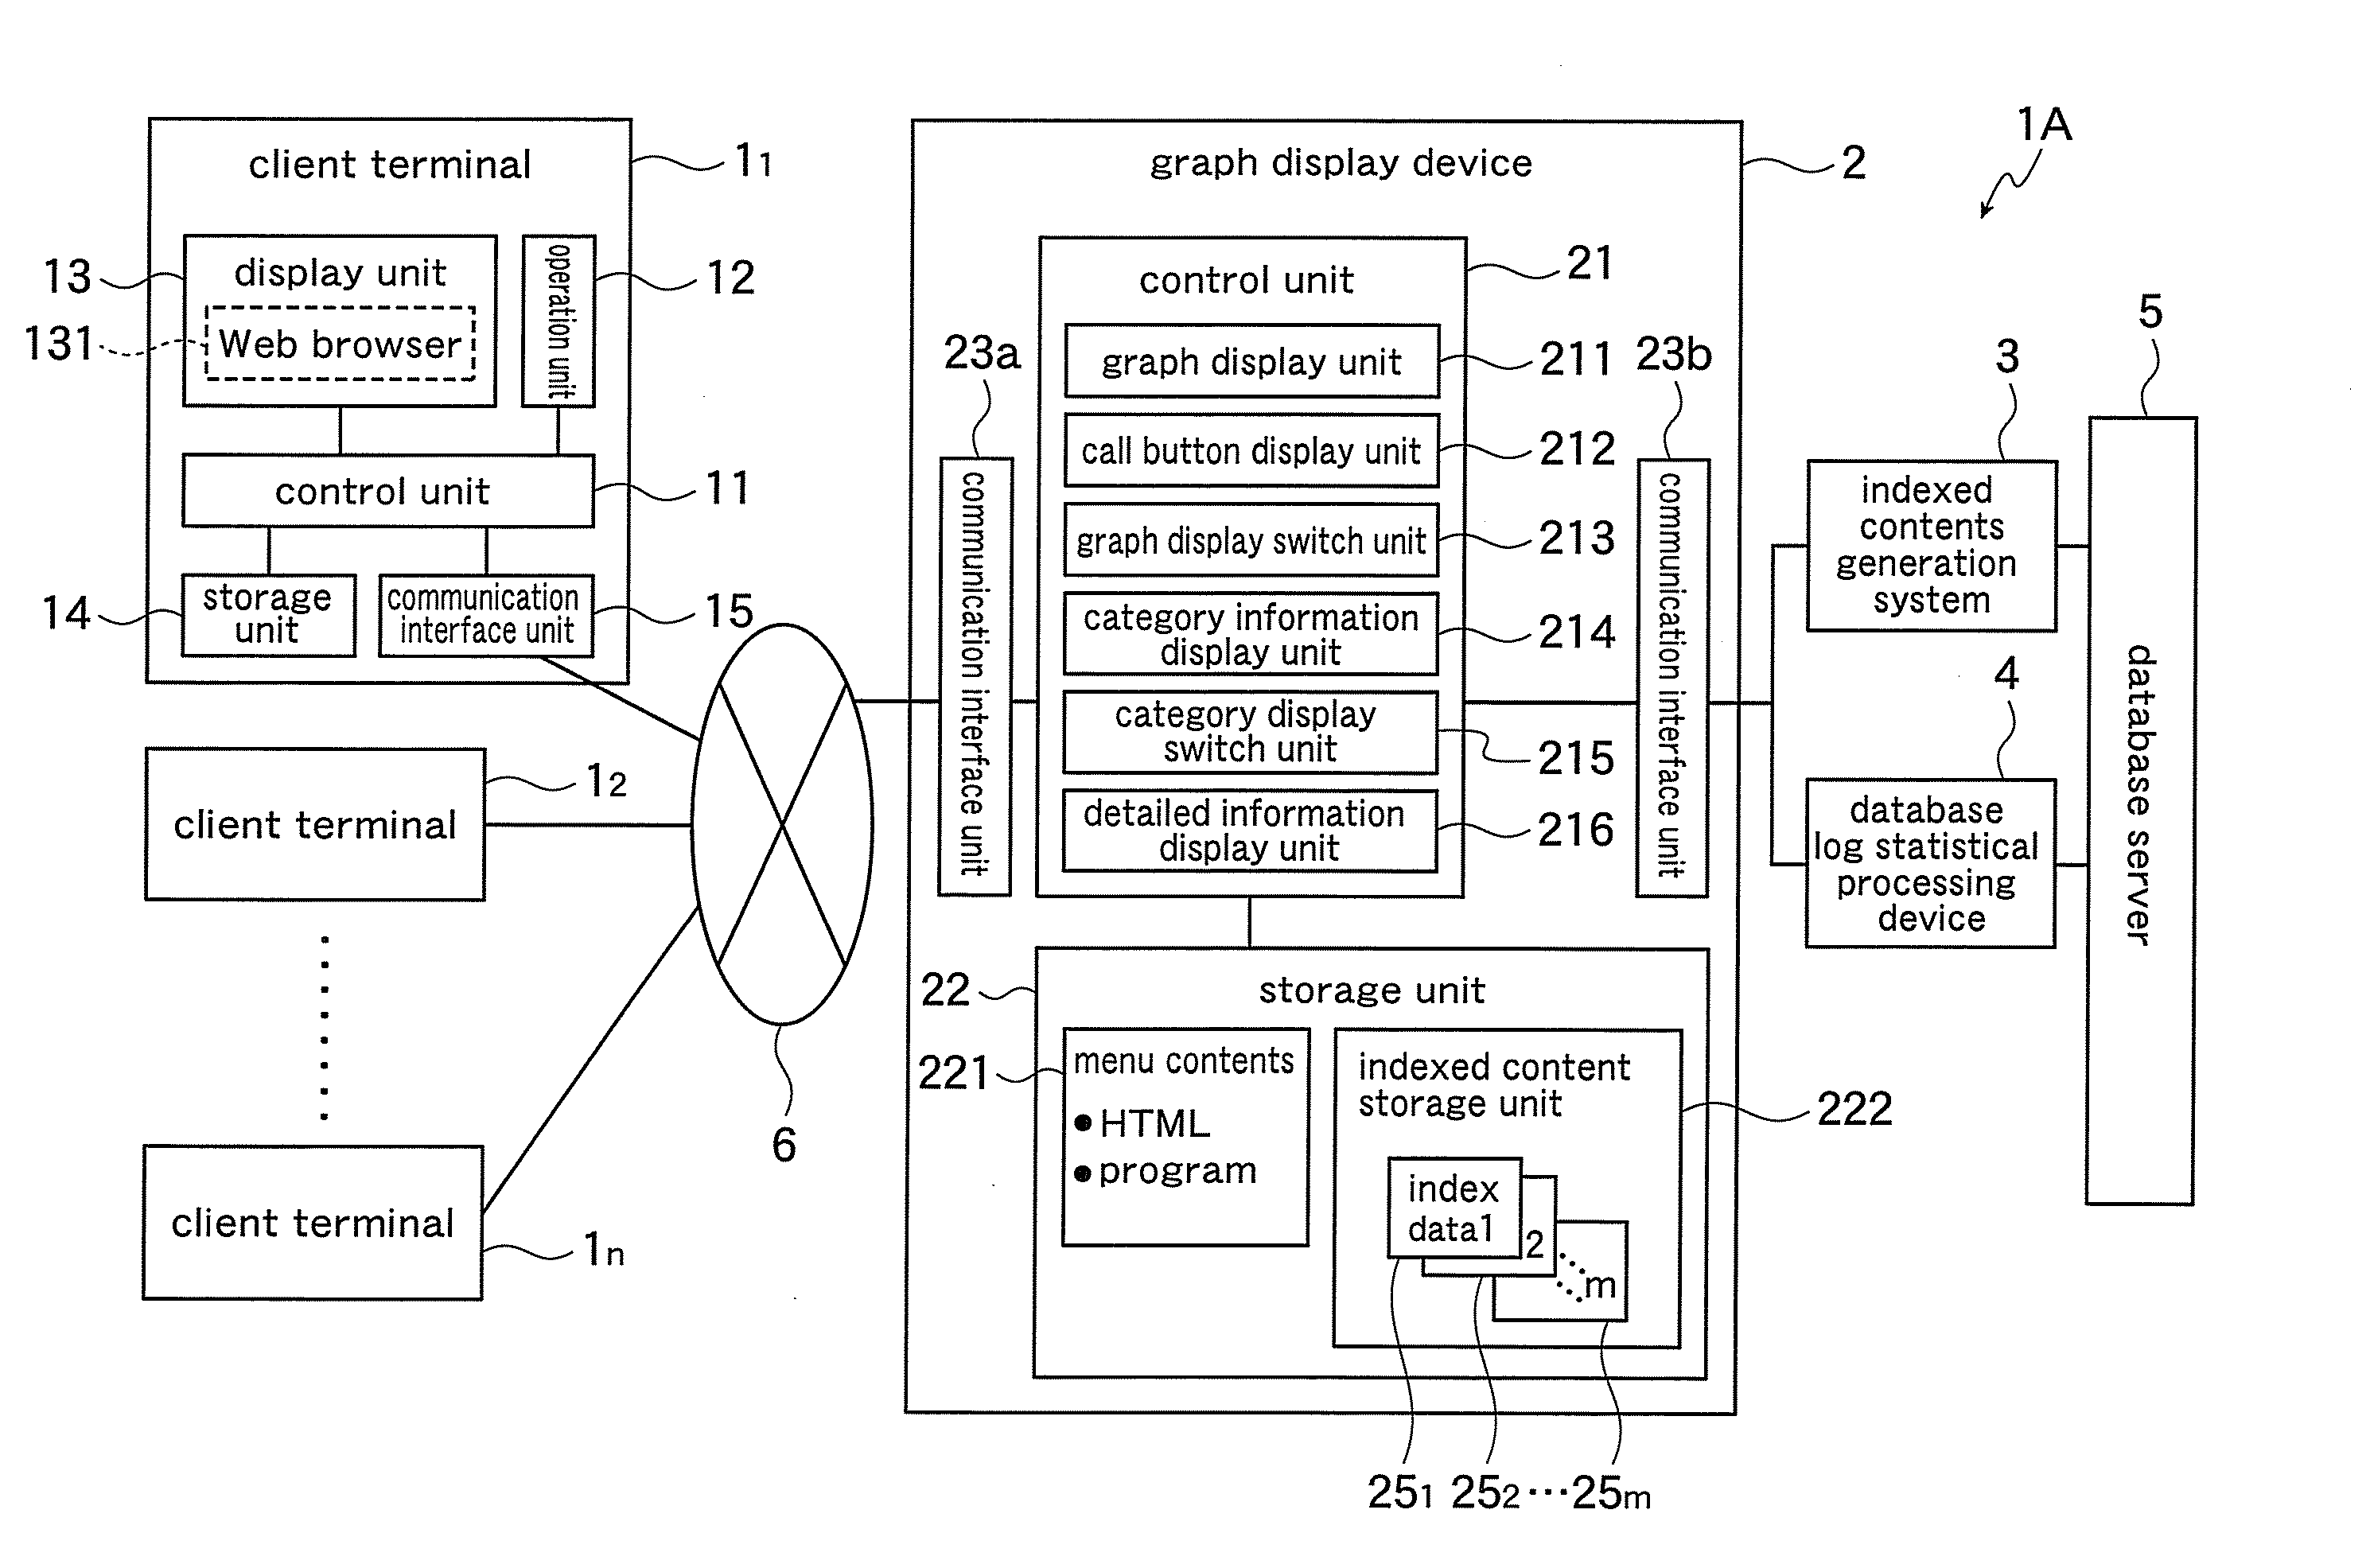
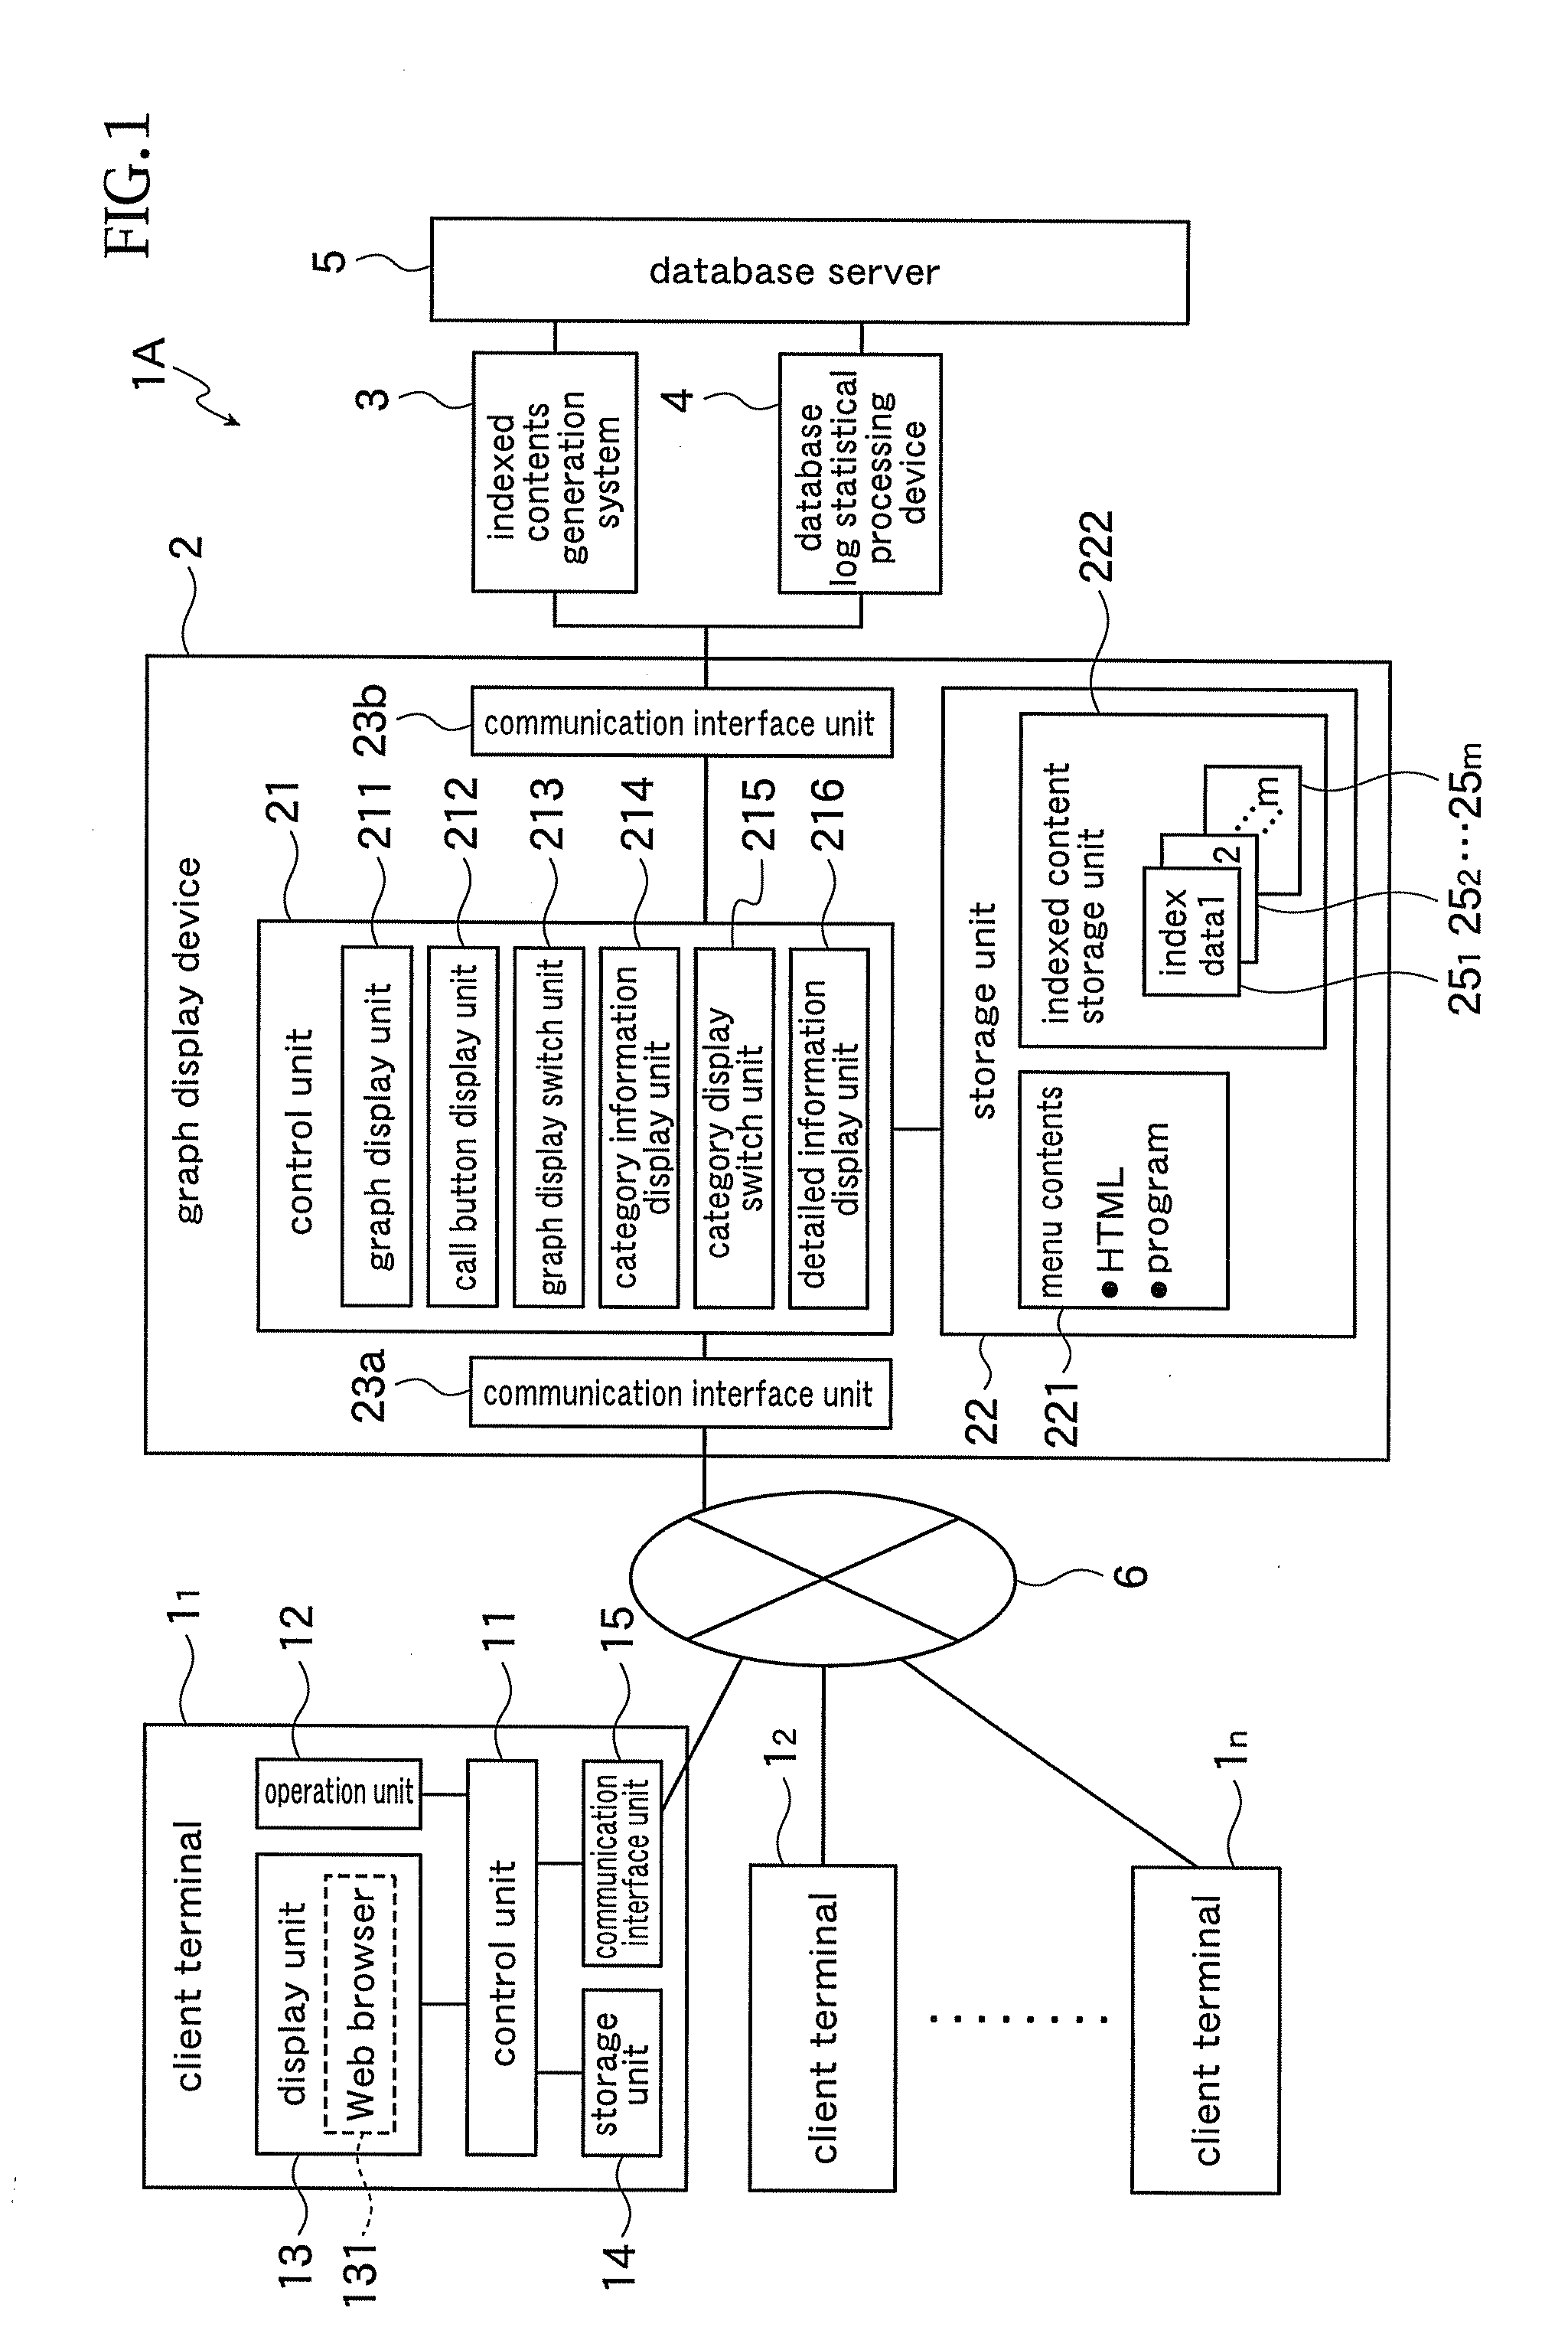
system having the graph display means for displaying the graphs stored in the storage means on the specified position of the graph display area, so the
graph based on the economic statistical data can be displayed by the client terminal. Furthermore, the present invention comprises the call button display means for displaying the call buttons, which is used for displaying the graphs on the graph display area, on the call button display area provided in the display area of the client terminal in order, so the present invention can select the desired graph form plural graphs quickly and appropriately, and display it. In addition, the switched graph is always displayed on the specified area in the graph display area, so the graphs can be compared easily in a visual and feeling manner. Additionally, the present invention can display only the necessary graphs on the graph display area, so the graphs can be displayed on the display means in a condition easy to view even if compared graphs are many. As a result, the present invention can display easily and quickly the graphs generated in connection with the economic statistical data in the condition easy to view and easy to compare appropriately, so the
usability for many kinds of investors etc. can be improved.
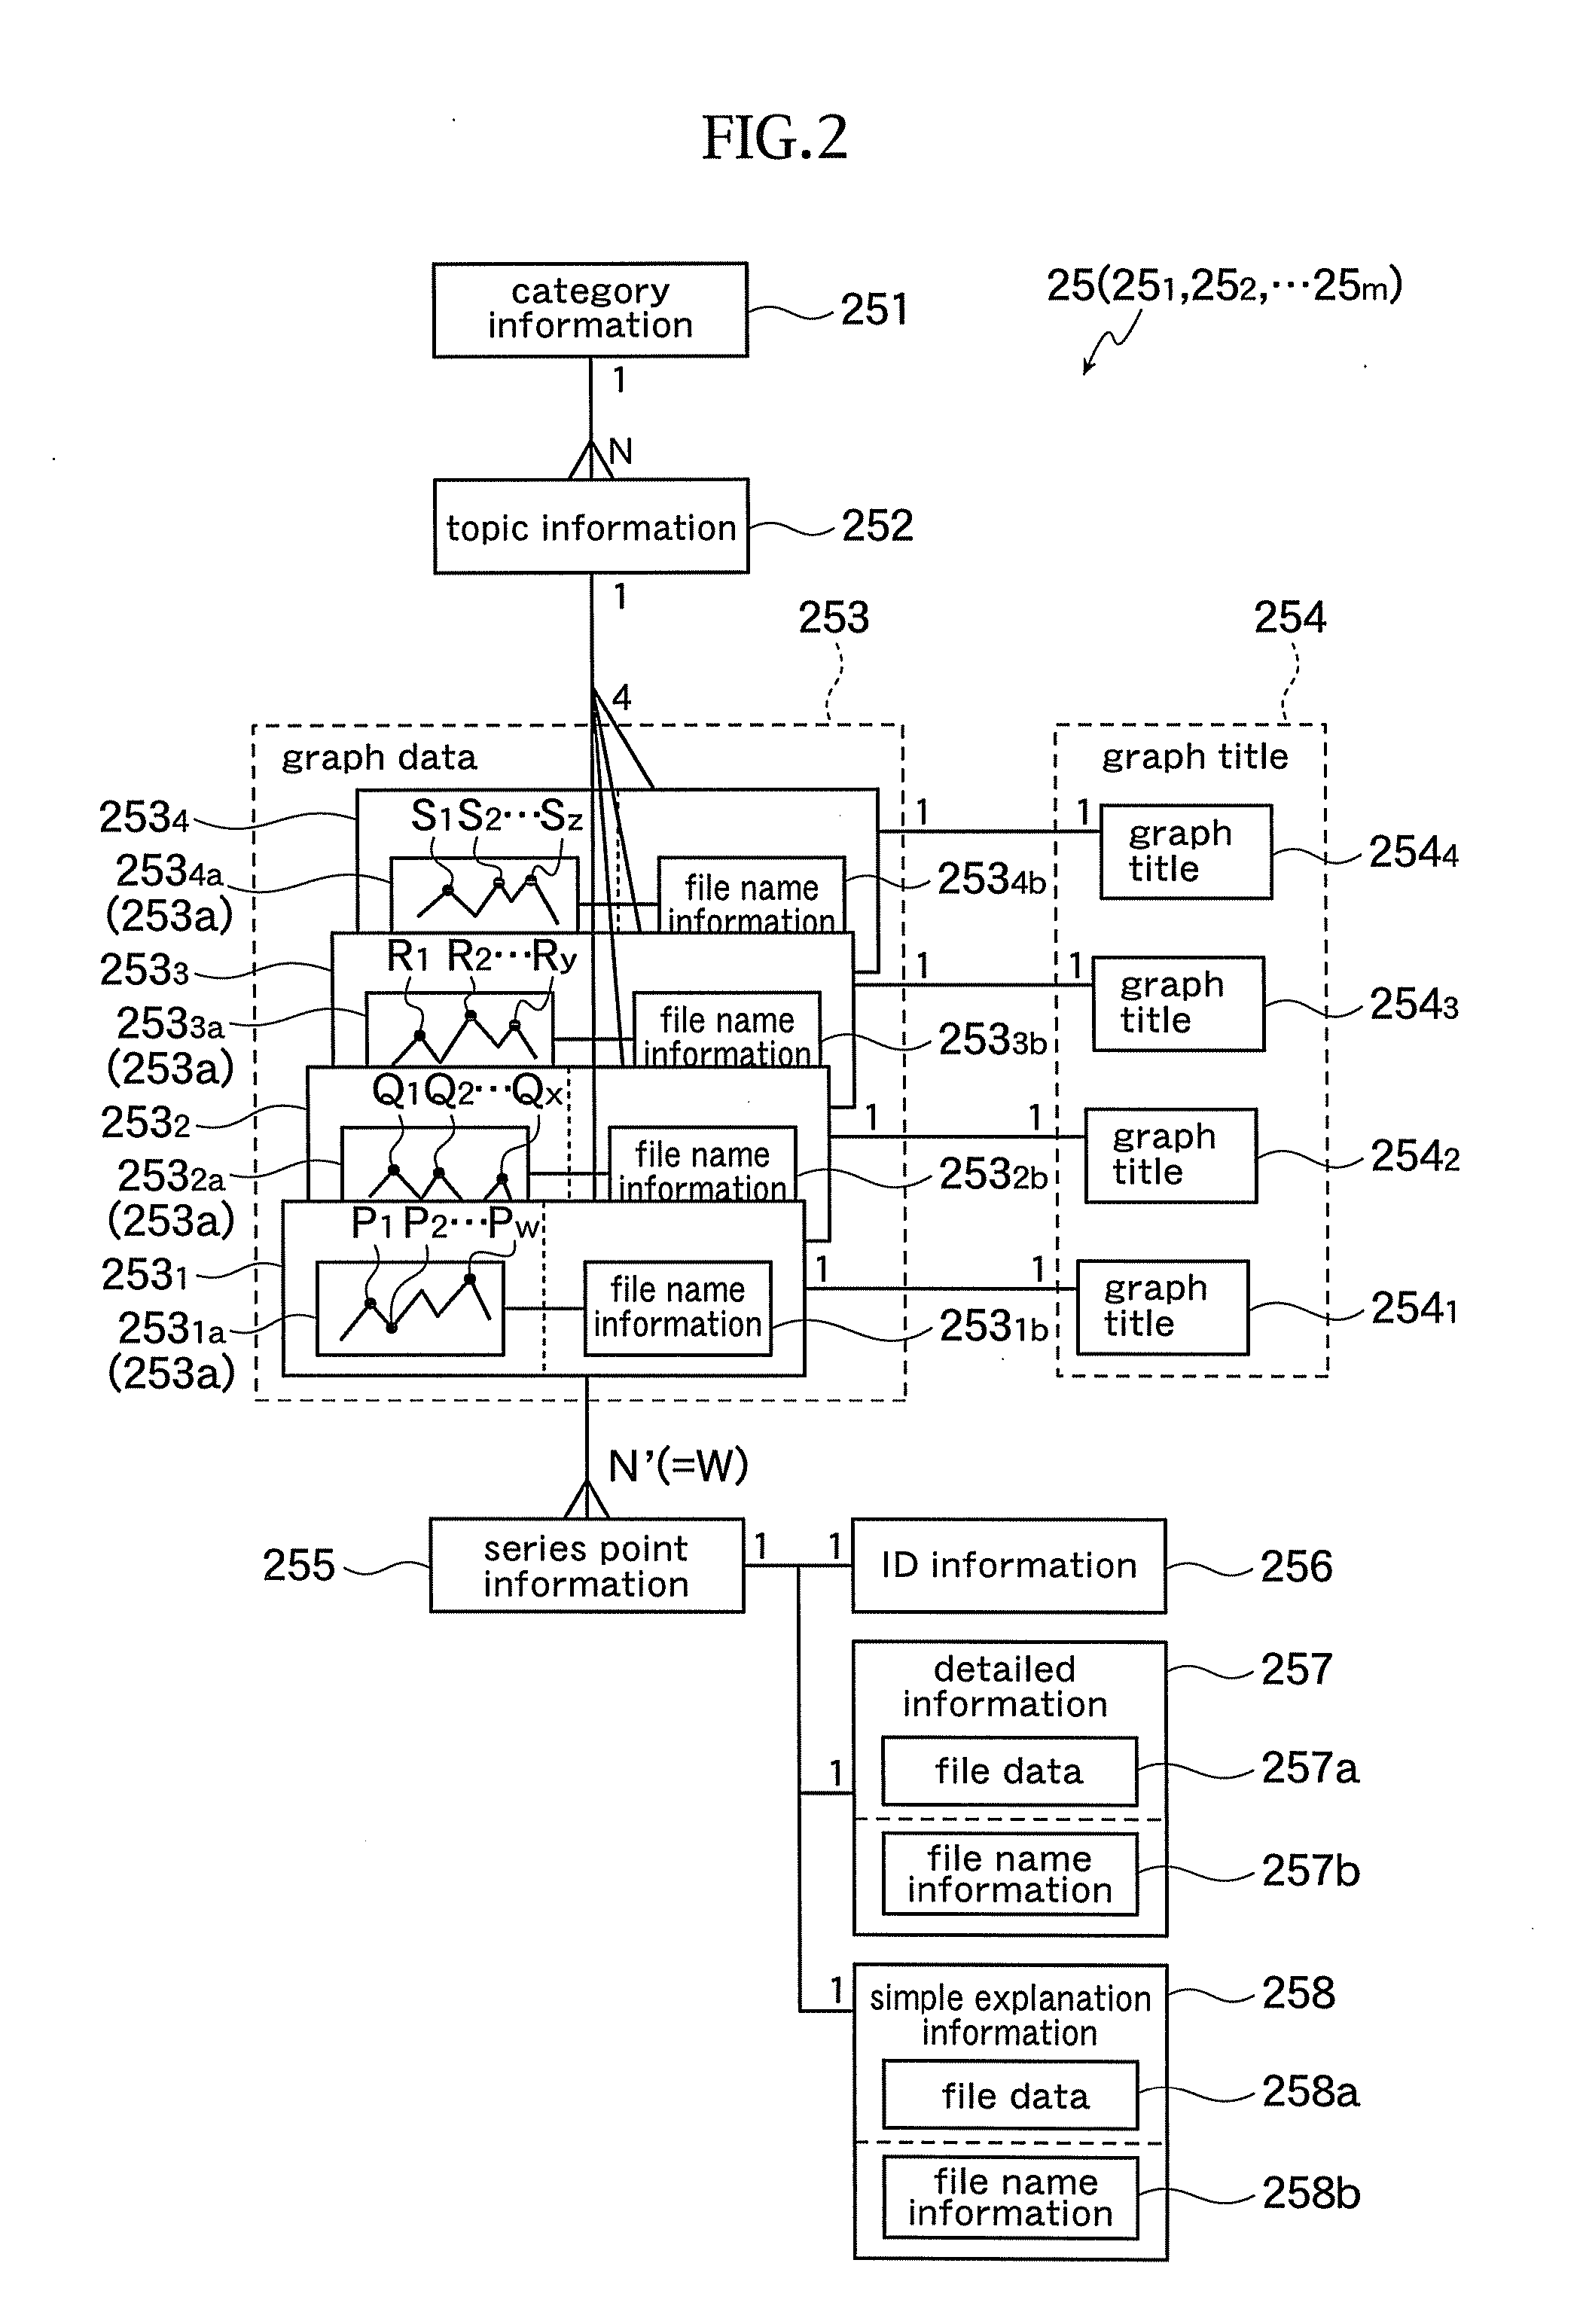
[0019]According to the present invention of (2), the storage means stores the topic information generated according to kind etc. of information indicated by the individual graphs and being related to the corresponding graph as attribute information, the call button display means displays the topic information related to the individual graphs when the call button is operated, the graph display switch means switches the displayed graph on the graph display area to a graph corresponding to a call instruction, by using the attribute information related to the call button corresponding to the call instruction. Therefore, the investors etc. using the client terminal can make each of the call buttons to display the topic information closely related to the meanings and contents of the graph, and make the graph to be displayed on the graph display area while viewing the displayed topic information. As a result, the graph can be selected more quickly and easily, and so the
usability for many kinds of investors etc. can be improved.
[0020]According to the present invention of (3), the operation of the operation means for performing the call instruction to the call button is a mouse over toward the call button displayed on the display means, so the graph can be switched quickly by performing a mouse over by the mouse cursor toward the call button located in order. In addition, the graphs displayed on the display means can be switched continuously and speedily by continuously performing mouse over of the mouse cursor toward the plural call buttons. As a result, the graph can be selected more quickly and easily, and so the
usability for many kinds of investors etc. can be improved.
[0021]According to the present invention of (4), the graph display means continues the graph displaying based on the instruction input from the operation means of the client terminal. Therefore, the present invention can keep the displaying of graph in the case where keeping of the graph displaying is necessary, and so the usability for many kinds of investors etc. can be improved.
[0022]According to the present invention of (5), the graph display means can simultaneously display plural graphs being related each other in advance, so the closely related graphs can be displayed simultaneously on single graph display area. As a result, the closely related graphs can be compared easily, and so the usability for many kinds of investors etc. can be improved.
[0023]According to the present invention of (6), the graph display means generates a graph in which the
horizontal axis indicates
time information, and the graph display means displays the graphs in which each of the graphs displayed at the same position has the
horizontal axis of substantially the same coordinate and substantially the same position. Therefore, the graph display area can effectively unify the coordinates and displayed positions of time axis between the graphs corresponding to the economic statistical data of
time series. As a result, it is easy for the users to visually compare the information of the graphs, because all of
time information of the graphs are unified. Consequently, the present invention can makes it easier to compare the graphs in a visual and feeling manner, and so the usability for many kinds of investors etc. can be improved.

