Quantitative liquid analysis method by spectrum baseline correction

A quantitative analysis and baseline correction technology, applied in the measurement of color/spectral characteristics, etc., can solve the problems of long test time, error, inability and so on

Inactive Publication Date: 2013-05-15
HUAZHONG UNIV OF SCI & TECH
View PDF4 Cites 9 Cited by
  • Summary
  • Abstract
  • Description
  • Claims
  • Application Information

AI Technical Summary

Problems solved by technology
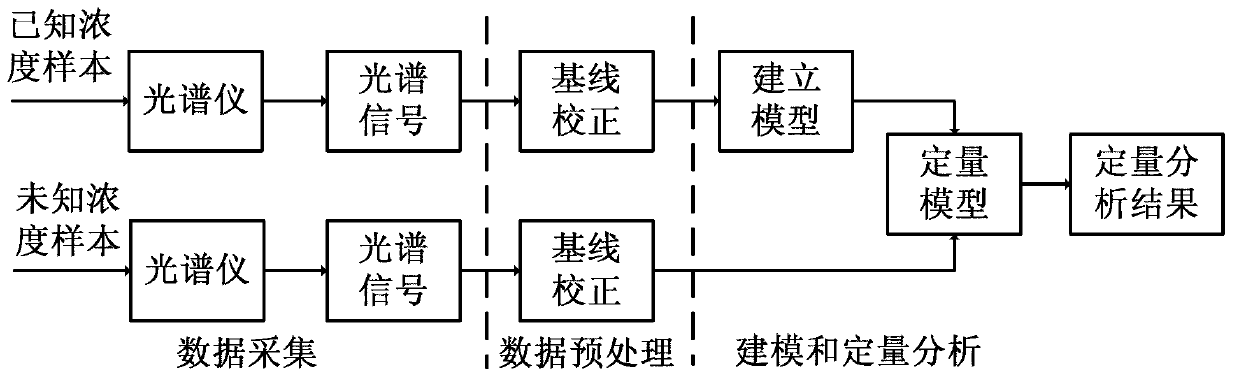
The disadvantages of chromatographic analysis are: 1. The existence of water in the liquid will damage the instrument and reduce the service life of the instrument. Before the test, complex pretreatment of the liquid is required; 2. Chromatographic quantitative analysis, usually using the normalized area size of the substance as The content of the substance, in fact, such a calculation itself will have a large error, and subsequent analysis cannot be performed; if a more accurate analysis is required, it is necessary to prepare solutions of different concentrations to draw a working curve, and perform quantitative analysis through the working curve. The analysis process works Large quantity; 3. Long test time: usually it takes about 40 minutes to test a sample, which is not conducive to online detection in production and experiments
The disadvantages of this method are: 1. The measurement is expensive: multiple elements cannot be analyzed at the same time, different metal lamps need to be configured to measure different metal ions, the service life of the metal lamp is short, and the price is expensive
2. Only the content of metal ions can be measured, and the quantitative analysis of organic matter cannot be done
3. The sensitivity of atomic absorption spectrometry to determine refractory elements is low, and it is impossible to measure refractory elements
However, the disadvantages of spectral quantitative analysis are: 1. There is inevitably baseline drift in the data acquisition process, and the existence of baseline drift affects the accuracy of quantitative analysis
2. The noise cannot be effectively suppressed, causing large errors in the identification results
However, these methods have disadvantages: 1. They have certain limitations, and some cannot be used for baseline correction of infrared spectra; 2. It is necessary to specify parameters for the algorithm, and the setting of parameters is related to the characteristics of the spectrum. The parameters are not optimal; 3. The calculation time is long, and it takes many iterations to get the result
[0007] In summary, there is no ideal method for quantitative analysis of liquid substances in the prior art

Method used


Image

  • Quantitative liquid analysis method by spectrum baseline correction
  • Quantitative liquid analysis method by spectrum baseline correction
  • Quantitative liquid analysis method by spectrum baseline correction

Examples


Embodiment 1

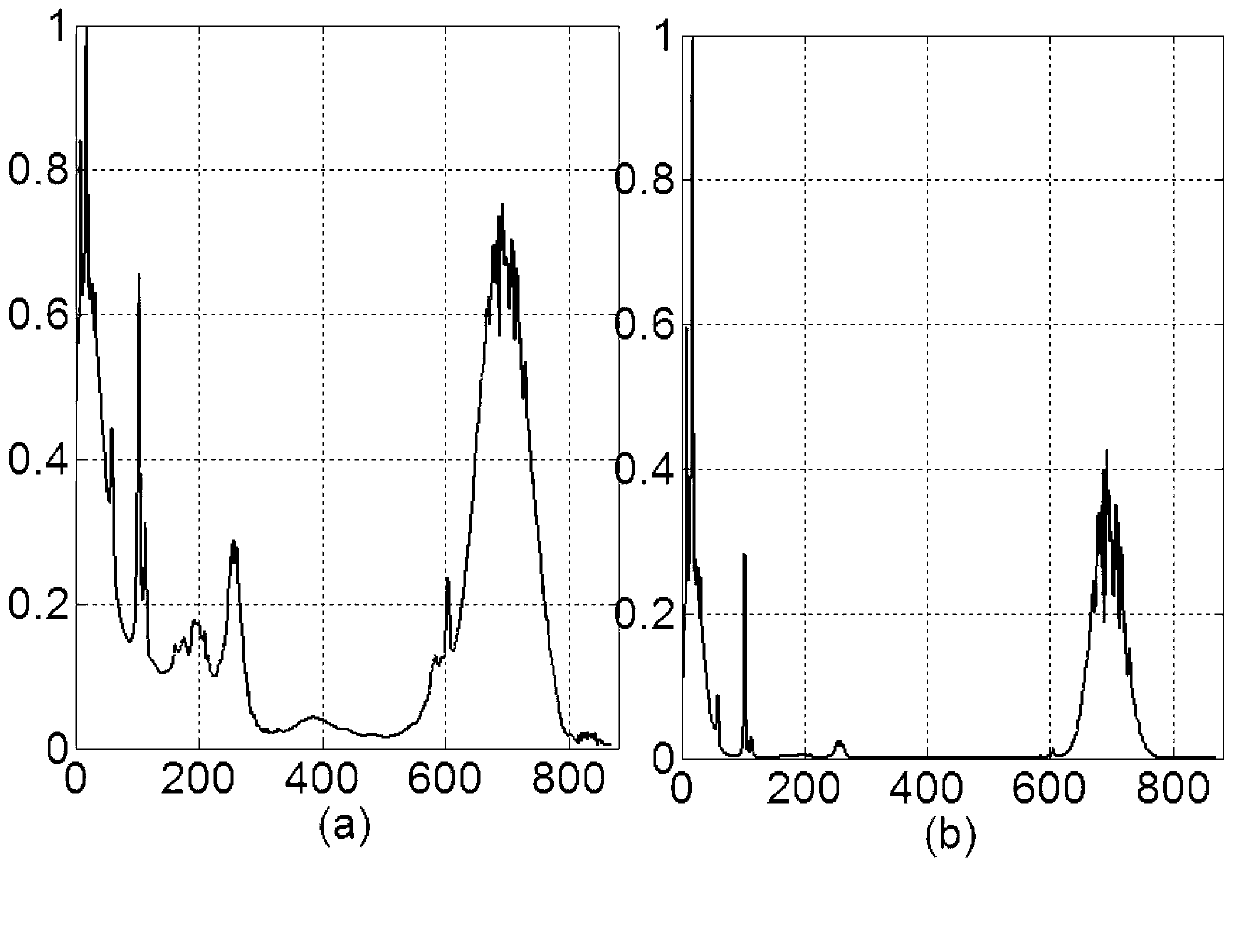
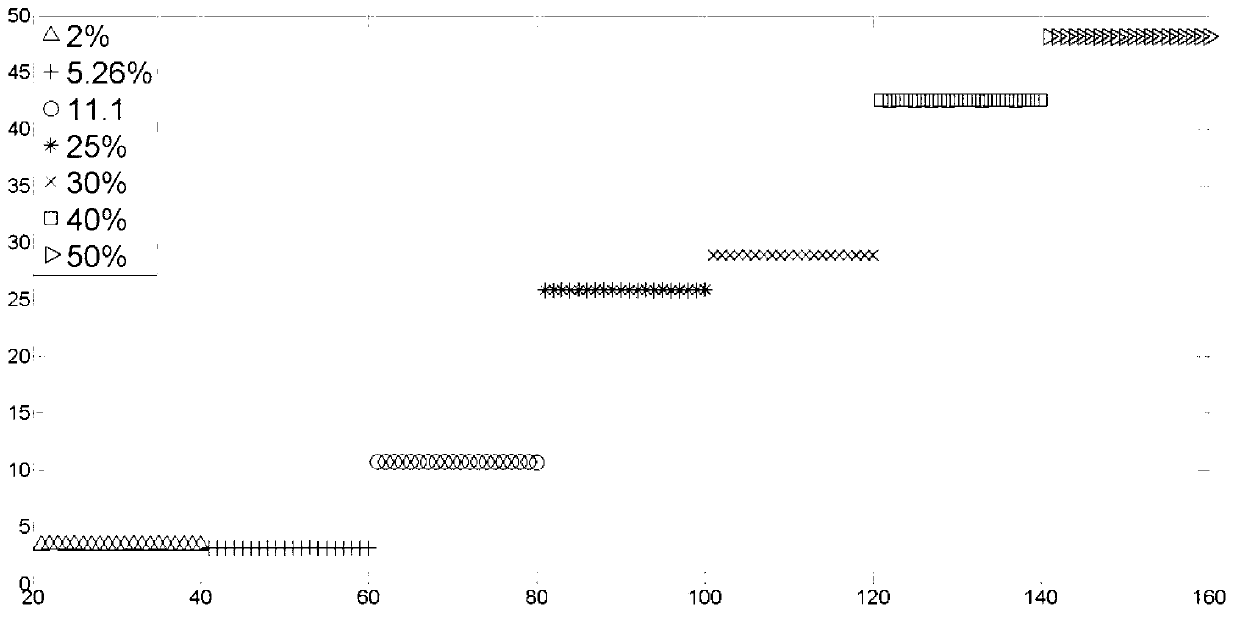
[0117] Quantitative analysis of ethanol concentration: collect infrared spectra of ethanol solutions with different concentrations, the concentrations are 2%; 5.26%; 11.1%; 25%; 30%; 40%; 50%. The samples of each concentration were measured 40 times, and a total of 280 samples were obtained. 20 samples of each concentration were selected, a total of 140 were used as training samples, and the remaining 140 were used as test samples. Infrared spectra before and after calibration such as image 3 , Figure 4 As shown in the figure, it can be seen that the concentration content error of the test result before correction is very large; the concentration content of the test result after correction is accurate.

Embodiment 2

[0119] Quantitative analysis of ethyl acetate concentration: collect infrared spectra of different concentrations of ethyl acetate and ethanol aqueous solution, the concentration of ethyl acetate is 1.14%; 1.25%; 1.4%; 1.6%; 1.8%; the concentration of ethanol is 50% . Samples of each concentration were measured 40 times, a total of 200 samples were obtained, 20 samples of each concentration were selected, a total of 100 were used as training samples, and the remaining 100 were used as test samples. Infrared spectra before and after calibration such as Figure 5 , Image 6 As shown in the figure, it can be seen that the concentration content error of the test result before correction is very large; the concentration content of the test result after correction is accurate.


PUM


Abstract

The invention belongs to a chemical quantitative analysis method, and relates to a quantitative liquid analysis method by spectrum baseline correction, which aims to overcome the defects of long test time, high cost and large test result error of the prior art. The method comprises the following steps of: (1) data acquisition, comprising the steps of selecting an apparatus, setting parameters, firstly testing spectroscopic data without a sample, and secondly testing samples; (2) spectrum baseline correction, comprising the steps of figuring out a linear representation coefficient by optimizing a constraint model and acquiring a baseline-free spectrum according to the linear representation coefficient, thereby implementing the spectrum correction; (3) model building, comprising the step of building a quantitative analysis model by taking a sample with known concentration as a training sample through partial least squares; and (4) quantitative analysis, comprising the step of transmitting a sample with unknown concentration into the model, and computing to obtain a quantitative analysis result. The method has the advantages that the quantitative analysis of liquid materials does not need complex sample pretreatment; the test cost is low; the test speed is high, and the method is suitable for online testing; and the quantitative analysis result is exact and reliable.

Description

technical field [0001] The invention belongs to chemical quantitative analysis methods, in particular to a quantitative analysis method for spectral baseline correction of liquid substances. Background technique [0002] Quantitative analysis is a common method in analytical chemistry. Because its results are more objective and can better reveal the nature of samples, it is widely used in food, medicine, chemical industry, judicial identification and other fields. The commonly used quantitative analysis methods include the following: [0003] Chromatography: Chromatography is a common method for quantitative analysis. Chromatography utilizes the selective distribution of different substances in different phase states, and elutes with the mixture in the mobile phase of the stationary phase. Different substances in the mixture will move along at different speeds. The stationary phase moves and finally achieves the effect of separation. The disadvantages of chromatographic an...

Claims


Application Information

Patent Timeline
Patent Type & Authority Applications(China)
IPC IPC(8): G01N21/25
Inventor 牟怿尤新革徐端全周龙曾武刘延申杜康
Owner HUAZHONG UNIV OF SCI & TECH
Why Eureka
Try Eureka