Method and system for visually modeling research big data on basis of expanding three-dimensional histogram

A modeling method and histogram technology, applied in the field of big data processing, can solve the problems of not wide applicability, irreversible data processing process, low fidelity, etc., to achieve wide applicability, overcome irreversibility defects, fidelity high effect

Active Publication Date: 2017-06-09
SOUTH CHINA NORMAL UNIVERSITY +1
View PDF5 Cites 4 Cited by
  • Summary
  • Abstract
  • Description
  • Claims
  • Application Information

AI Technical Summary

Problems solved by technology

[0015] (1) It can only realize simple partial data visualization, which is only suitable for intuitive comparison of the same data type, and cannot form a unified overall visual analysis result, and its applicability is not wide;
[0016] (2) Visualizatio

Method used


Image

  • Method and system for visually modeling research big data on basis of expanding three-dimensional histogram
  • Method and system for visually modeling research big data on basis of expanding three-dimensional histogram
  • Method and system for visually modeling research big data on basis of expanding three-dimensional histogram

Examples


Embodiment 1

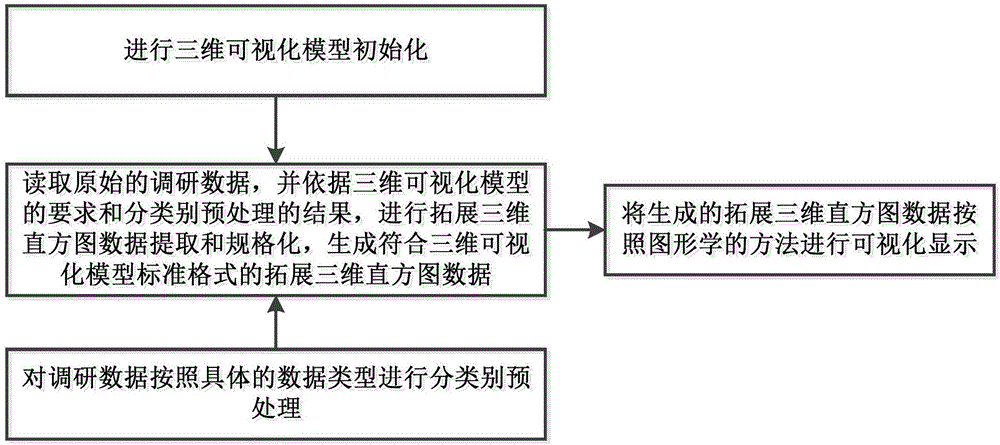
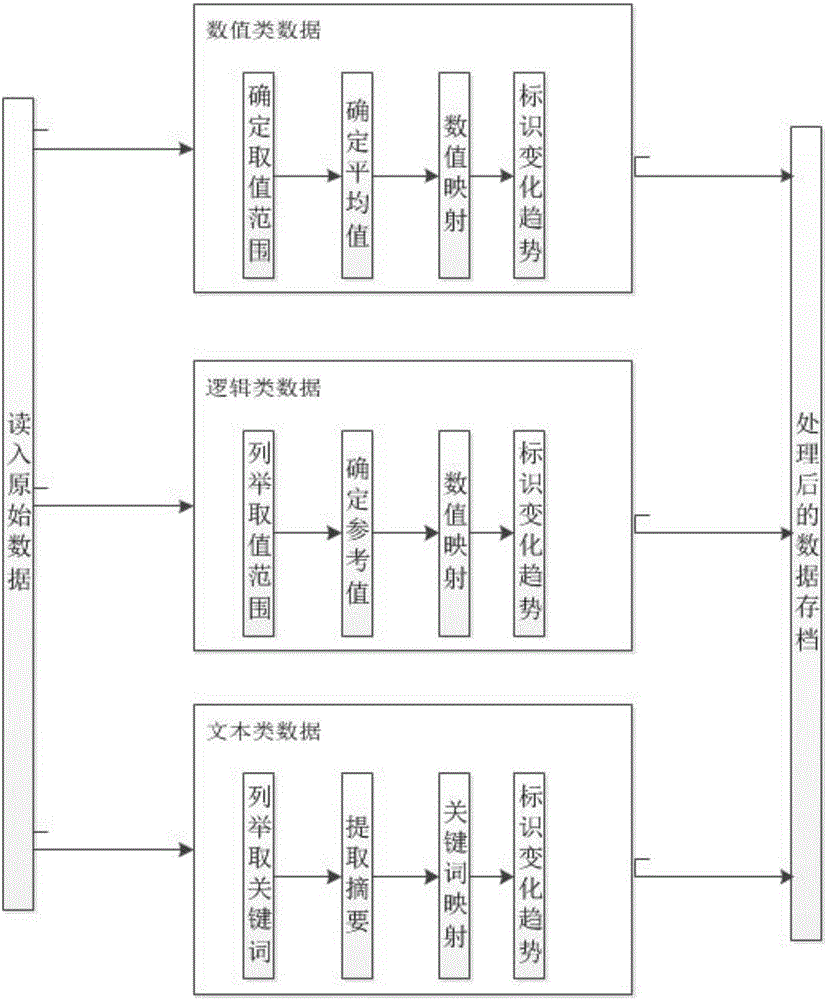
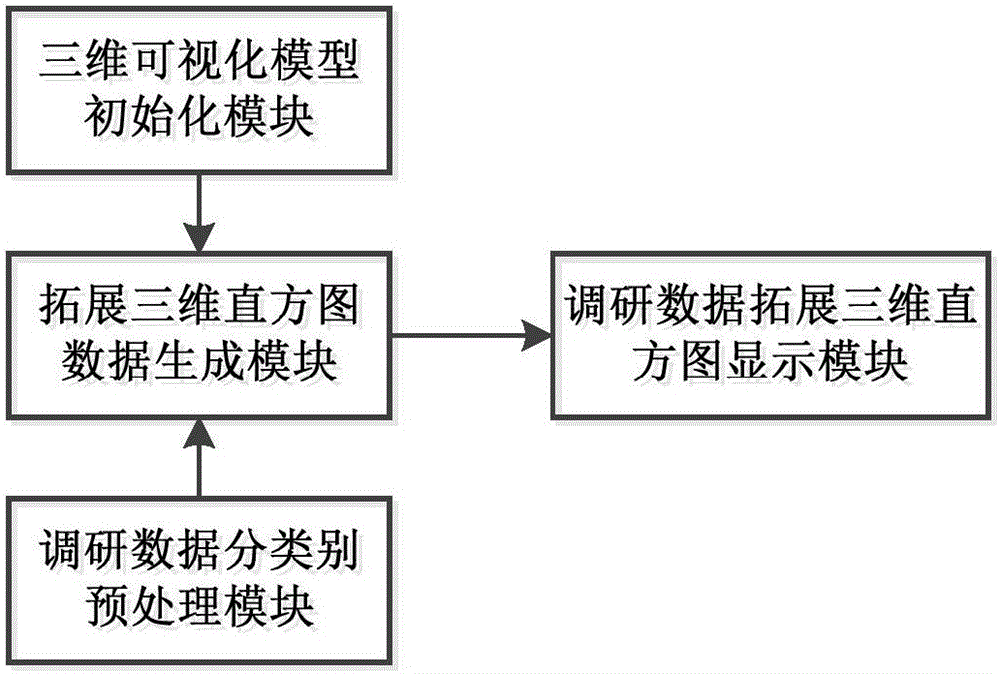
[0109] Aiming at the problems of limited applicability, low fidelity and insufficient effectiveness of existing technologies, the present invention proposes a new visualization modeling method and system for research big data based on extended three-dimensional histograms. The key point of the present invention is to upgrade the multi-level, multi-dimensional, and multi-type survey data processing process from the conventional intuitive comparison method of the same data type, clustering to a unified overall visual analysis model. The present invention is based on the expanded three-dimensional histogram, and the expanded three-dimensional histogram is expanded on the basis of the three-dimensional histogram: the horizontal dimension is composed of different parts of the same level and expanded to have different levels such as provinces, cities, counties, and schools. The composition of different reporting subjects provides conditions for subsequent big data processing of diffe...

Embodiment 2

[0119] The evaluation of the application level of educational information technology is a complex systematic process, and the modeling process using the visual modeling system of Embodiment 1 specifically includes the following steps:

[0120] (1) Establish an index system for information technology application evaluation, including the main evaluation indicators for planning, management, investment, application, training, etc., and maintain relative stability in previous evaluations;

[0121] (2) Establish a network evaluation system, try to conduct cross-regional investigations through network means, and accumulate sufficient research data;

[0122] (3) Establish the visual modeling system of Embodiment 1, and improve the traditional data processing method towards the direction of visual processing and analysis;

[0123] (4) Perform visual analysis and presentation of survey data according to the visual modeling system of Embodiment 1;

[0124] (5) On the basis of visual anal...


PUM


Abstract

The invention discloses a method and system for visually modeling research big data on the basis of an expanding three-dimensional histogram. The method comprises the following steps: initializing a three-dimensional visual model; pre-treating the research data in classification according to the specific data classification; reading the original research data, extracting and standardizing the expanding three-dimensional histogram data according to the requirement of the three-dimensional visual model and the result of the pretreatment in classification, and generating the expanding three-dimensional histogram data conforming to the standard formula of the three-dimensional visual model; and visually displaying the generated expanding three-dimensional histogram data according to a graphics method. According to the invention, on the basis of the expanding three-dimensional histogram, a uniform overall visual analysis result is formed, and the applicability is higher; the visual chart of the expanding three-dimensional histogram is linked with the original research data, so that the fidelity is high; and a corresponding effective data pretreatment method is adopted according to different data classifications, so that the method is more effective. The method and system disclosed by the invention can be widely applied to the field of big data treatment.

Description

technical field [0001] The invention relates to the field of big data processing, in particular to a method and system for visual modeling of survey big data based on extended three-dimensional histograms. Background technique [0002] Educational equipment is a necessary condition for the modernization of education. Educational decision-making departments need to collect and count the research data on the application level of information technology to grasp the allocation of infrastructure in the process of educational informatization and to clarify the application of software and hardware facilities. Based on the survey data, comprehensively describe the progress of education informatization, generate corresponding application analysis reports, problem diagnosis, planning consultation and development decision-making and other reports, so as to use the rich survey data to analyze the implementation status, application effects and results of education informatization at all l...

Claims


Application Information

Patent Timeline
IPC IPC(8): G06F17/30G06F17/24G06Q10/06G06Q50/20
CPCG06F16/34G06F16/35G06F40/174G06F40/18G06Q10/0637G06Q50/20
Inventor 胡钦太黄昌勤张瑜卢春和
Owner SOUTH CHINA NORMAL UNIVERSITY
Why Eureka
Try Eureka