Graphical processing method and device for visualized big data association relationship

A technology of data association and processing methods, which is applied in the fields of electronic digital data processing, special data processing applications, structured data retrieval, etc., and can solve problems such as technical thresholds for ordinary users

Inactive Publication Date: 2017-07-14
北京数猎天下科技有限公司
View PDF4 Cites 10 Cited by
  • Summary
  • Abstract
  • Description
  • Claims
  • Application Information

AI Technical Summary

Problems solved by technology

This method depends on the implementation of various software manufacturers, and also requires relevant professional skills. For ordinary users, there are still technical barriers

Method used


Image

  • Graphical processing method and device for visualized big data association relationship
  • Graphical processing method and device for visualized big data association relationship
  • Graphical processing method and device for visualized big data association relationship

Examples


Embodiment Construction

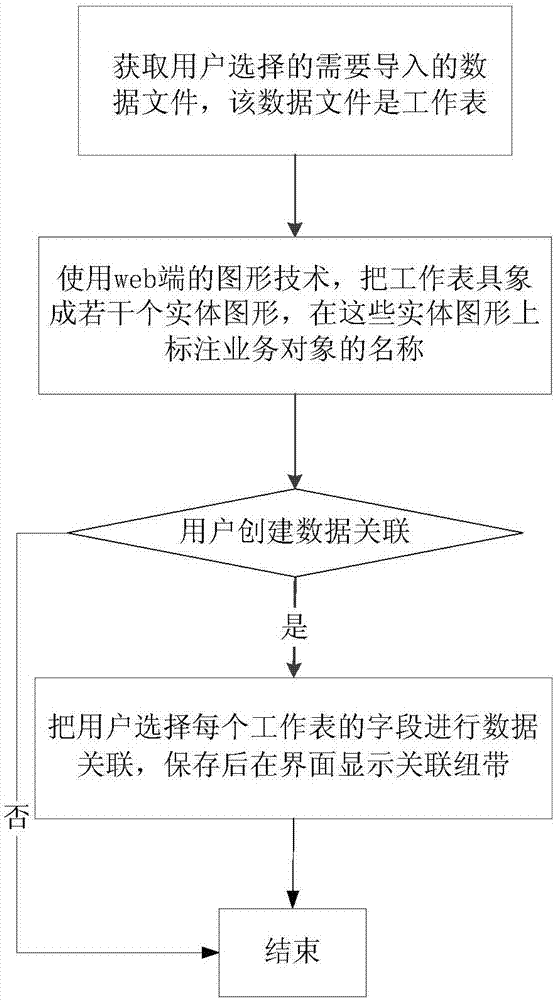
[0023] Such as figure 1 As shown, the graphical processing method of this big data visualization data correlation includes the following steps:

[0024] (1) Obtain the data file that needs to be imported selected by the user, and the data file is a worksheet;

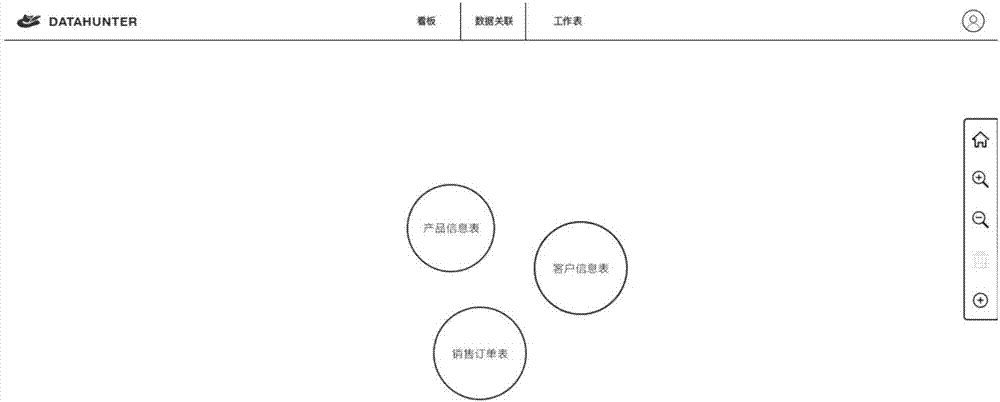
[0025] (2) Use the graphics technology on the web side to visualize the worksheet into several entity graphics, and mark the names of the business objects on these entity graphics;

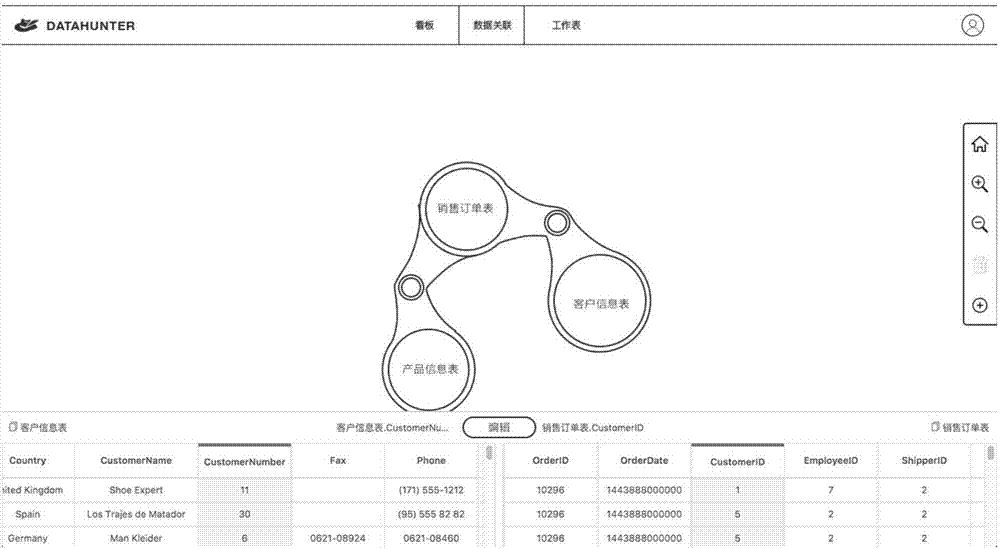
[0026] (3) When it is detected that the entity graphics directly collide or overlap, the user is prompted whether to create a data association, and if it is received, step (4) is executed, otherwise step (5) is executed;

[0027] (4) Associate the fields of each worksheet selected by the user for data association, and display the association link on the interface after saving;

[0028] (5) END.

[0029] The present invention uses the graphics technology on the web side to visualize the worksheets into individual entity graphics, such as ...


PUM


Abstract

The invention provides a graphical processing method for a visualized big data association relationship. The method and the device are characterized in that a simple, convenient and intuitive graphical operation interface is provided and enables a user to perform graphic association processing on existing data without programming foundation; the method and the device can be widely applied to data visual display and analyzing of each industry and help user to build own data self-service analyzing system. The method comprises the following steps: (1) acquiring data files which are selected by the user and are to be imported, wherein the data files are worksheets; (2) concretizing the worksheets into a plurality of entity graphs through the graphics technology of a web side, and marking the names of service objects on the entity graphs; (3) prompting the user whether to build data association while detecting that the entity graphs are directly impacted and overlapped; if so, carrying out step (4), and otherwise, carrying out step (5); (4) performing data association on fields, selected by the user, of each worksheet, storing, and then displaying an association link through an interface; and (5) finishing. The invention also provides a device.

Description

technical field [0001] The present invention relates to the technical field of big data visualization, in particular to a graphical processing method for big data visualization data correlation, and a device using the method, mainly for non-database professionals, providing a set of simple and intuitive graphical operations The interface allows users to graphically correlate existing data without programming foundation. Background technique [0002] With the in-depth business integration of computer application systems in various industries, the resulting data from various sources is also accumulating day by day, and various requirements for data application and mining have emerged as the times require. [0003] As small as excel, as large as relational databases such as mysql, oracle, sqlserver, and big data platforms that have emerged in recent years such as Hadoop, they can all be used as data storage methods. There are a large number of associations in the business data ...

Claims


Application Information

Patent Timeline
Patent Type & Authority Applications(China)
IPC IPC(8): G06F17/30
CPCG06F16/22G06F16/26
Inventor 孙辉程凯征
Owner 北京数猎天下科技有限公司
Why Eureka
Try Eureka