WebGL-based three-dimensional visual display system and data visualization method

A three-dimensional, data processing technology, applied in the field of big data analysis, can solve the problems of poor platform compatibility, not supporting hardware acceleration, and low development efficiency, and achieve the effects of convenient deployment, good cross-platform, and convenient maintenance and update

A three-dimensional, data processing technology, applied in the field of big data analysis, can solve the problems of poor platform compatibility, not supporting hardware acceleration, and low development efficiency, and achieve the effects of convenient deployment, good cross-platform, and convenient maintenance and update

CN112256790AInactive Publication Date: 2021-01-22HUBEI TAIYUE SATELLITE TECH DEV CO LTD

Image

  • WebGL-based three-dimensional visual display system and data visualization method
  • WebGL-based three-dimensional visual display system and data visualization method
  • WebGL-based three-dimensional visual display system and data visualization method

Examples


Embodiment Construction

[0041]In order to make the purpose, technical solutions and advantages of the embodiments of the present invention clearer, the technical solutions in the embodiments of the present invention will be clearly and completely described below in conjunction with the drawings in the embodiments of the present invention. Obviously, the described embodiments It is a part of embodiments of the present invention, but not all embodiments. Based on the embodiments of the present invention, all other embodiments obtained by persons of ordinary skill in the art without creative efforts fall within the protection scope of the present invention.

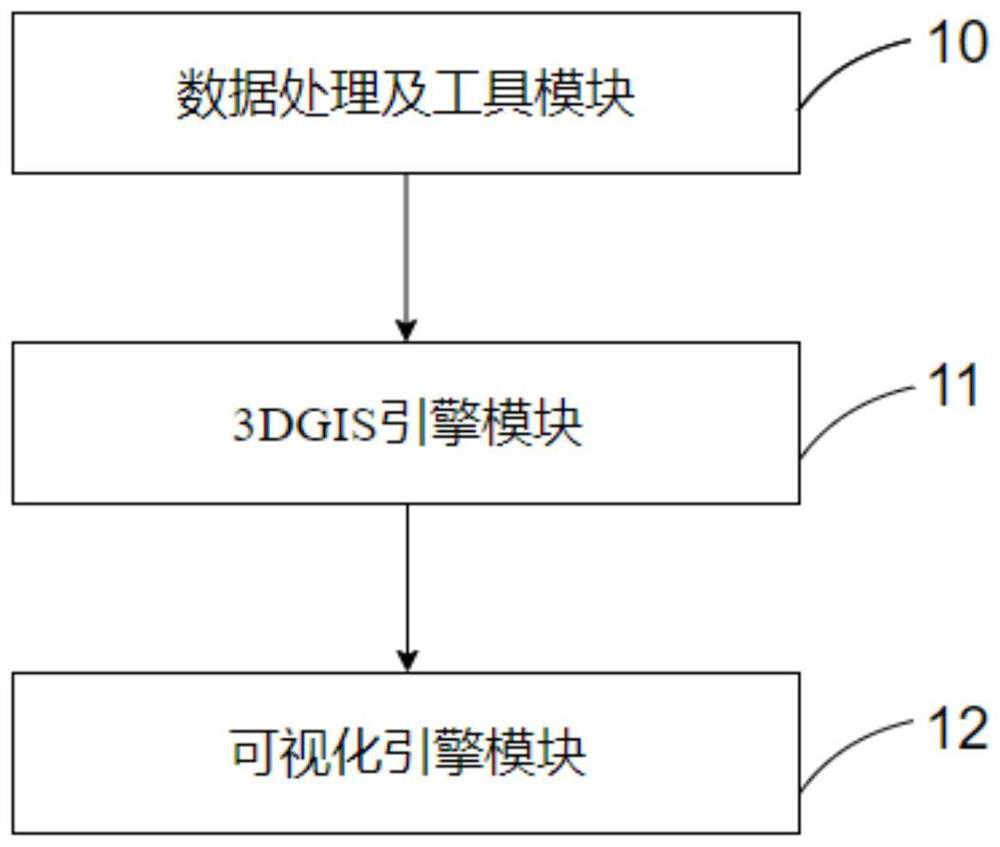
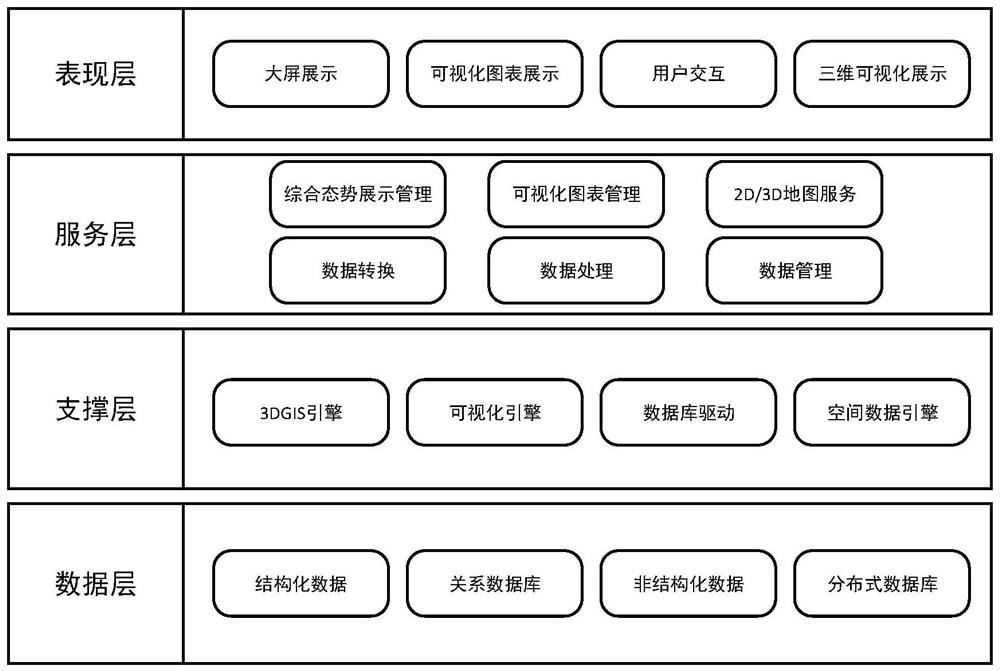
[0042] With the rapid development of current information technology, data information in various industries has changed from single to multi-dimensional. Especially in the era of big data, massive data contains complex multi-dimensional information, and the visualization of multi-dimensional information is usually realized by converting data into e...


PUM


Abstract

The embodiment of the invention provides a WebGL-based three-dimensional visual display system and a data visualization method. The WebGL-based three-dimensional visual display system comprises a dataprocessing and tool module, a 3DGIS engine module and a visualization engine module; the 3DGIS engine module is used for acquiring geographic space data and generating a 3DGIS map based on the geographic space data; and the visualization engine module is used for acquiring a 3DGIS map, charts and various statistical analysis numerical parameter information, fusing the charts and the various statistical analysis numerical parameter information by taking the 3DGIS map as a base map, superposing the charts and the various statistical analysis numerical parameter information on the base map, andperforming visualization display in a three-dimensional form. According to the invention, a three-dimensional GIS visualization system is achieved, and a set of effective solution is provided for related applications.

Description

technical field [0001] The present invention relates to the technical field of big data analysis, in particular to a three-dimensional visualization display system and data visualization method based on WebGL. Background technique [0002] With the rapid development of current information technology, data information in various industries has changed from single to multi-dimensional. Especially in the era of big data, massive data contains complex multi-dimensional information, and the visualization of multi-dimensional information is usually realized by converting data into easy-to-understand two-dimensional or three-dimensional graphics. However, the traditional statistical method of a single two-dimensional graph is difficult to meet the actual needs, and users cannot intuitively obtain accurate cognition of multi-dimensional information. Therefore, the 3D visualization technology that can display more dimensional information through layer overlay has attracted extensive...

Claims


Application Information

Patent Timeline
22 Jan 2021
Publication
CN112256790A
IPC
G06F16/26; G06F16/28; G06F16/29; G06T17/05
CPC
G06F16/29; G06F16/283; G06F16/26; G06T17/05
Inventors
张磊; 王书旺