Displaying ranked categories of data in a venn diagram

a data and venn diagram technology, applied in the field of user interfaces, can solve the problems of low sales volume and difficult data analysis, and achieve the effect of identifying high value/priority entries quickly

Active Publication Date: 2009-02-19
IBM CORP
View PDF7 Cites 21 Cited by
  • Summary
  • Abstract
  • Description
  • Claims
  • Application Information

AI Technical Summary

Benefits of technology

[0005]Aspects of the invention provide a solution that displays ranked categories of data in a Venn diagram. In particular, entries of data are assigned to one of a plurality of categories based on one or more attributes of the entries. The categories are then ranked for each of one or more criteria. Each criterion can use a unique set of the attributes to rank the categories. A Venn diagram is generated that includes a circle for each criterion and displays the rankings of the various categories using one or more visual representations of each category. For example, the rankings can be displayed using tag clouds for each category that are placed in each circle. Two or more circles can overlap in which case categories that have one or more entries that meet all the corresponding criteria can be displayed in the overlapping portion of the circles. In this manner, a user can utilize the Venn diagram to identify relationships between various criteria and the corresponding entries, and as a result, more readily identify high value / priority entries.

Problems solved by technology

For example, a company may offer numerous products that are in low demand and / or have a low sales volume.
However, with a sufficiently large distribution channel, the cumulative sales volume / demand for these products may comprise a market share that rivals or exceeds the relatively fewer high demand / sales volume products offered by the company.
However, this approach often filters out issues having a lower priority for the attribute, sometimes permanently, due to continually discovered higher priority issues.
However, it is often difficult to analyze the data, such as comparing two result sets.

Method used


Image

  • Displaying ranked categories of data in a venn diagram
  • Displaying ranked categories of data in a venn diagram
  • Displaying ranked categories of data in a venn diagram

Examples


Embodiment Construction

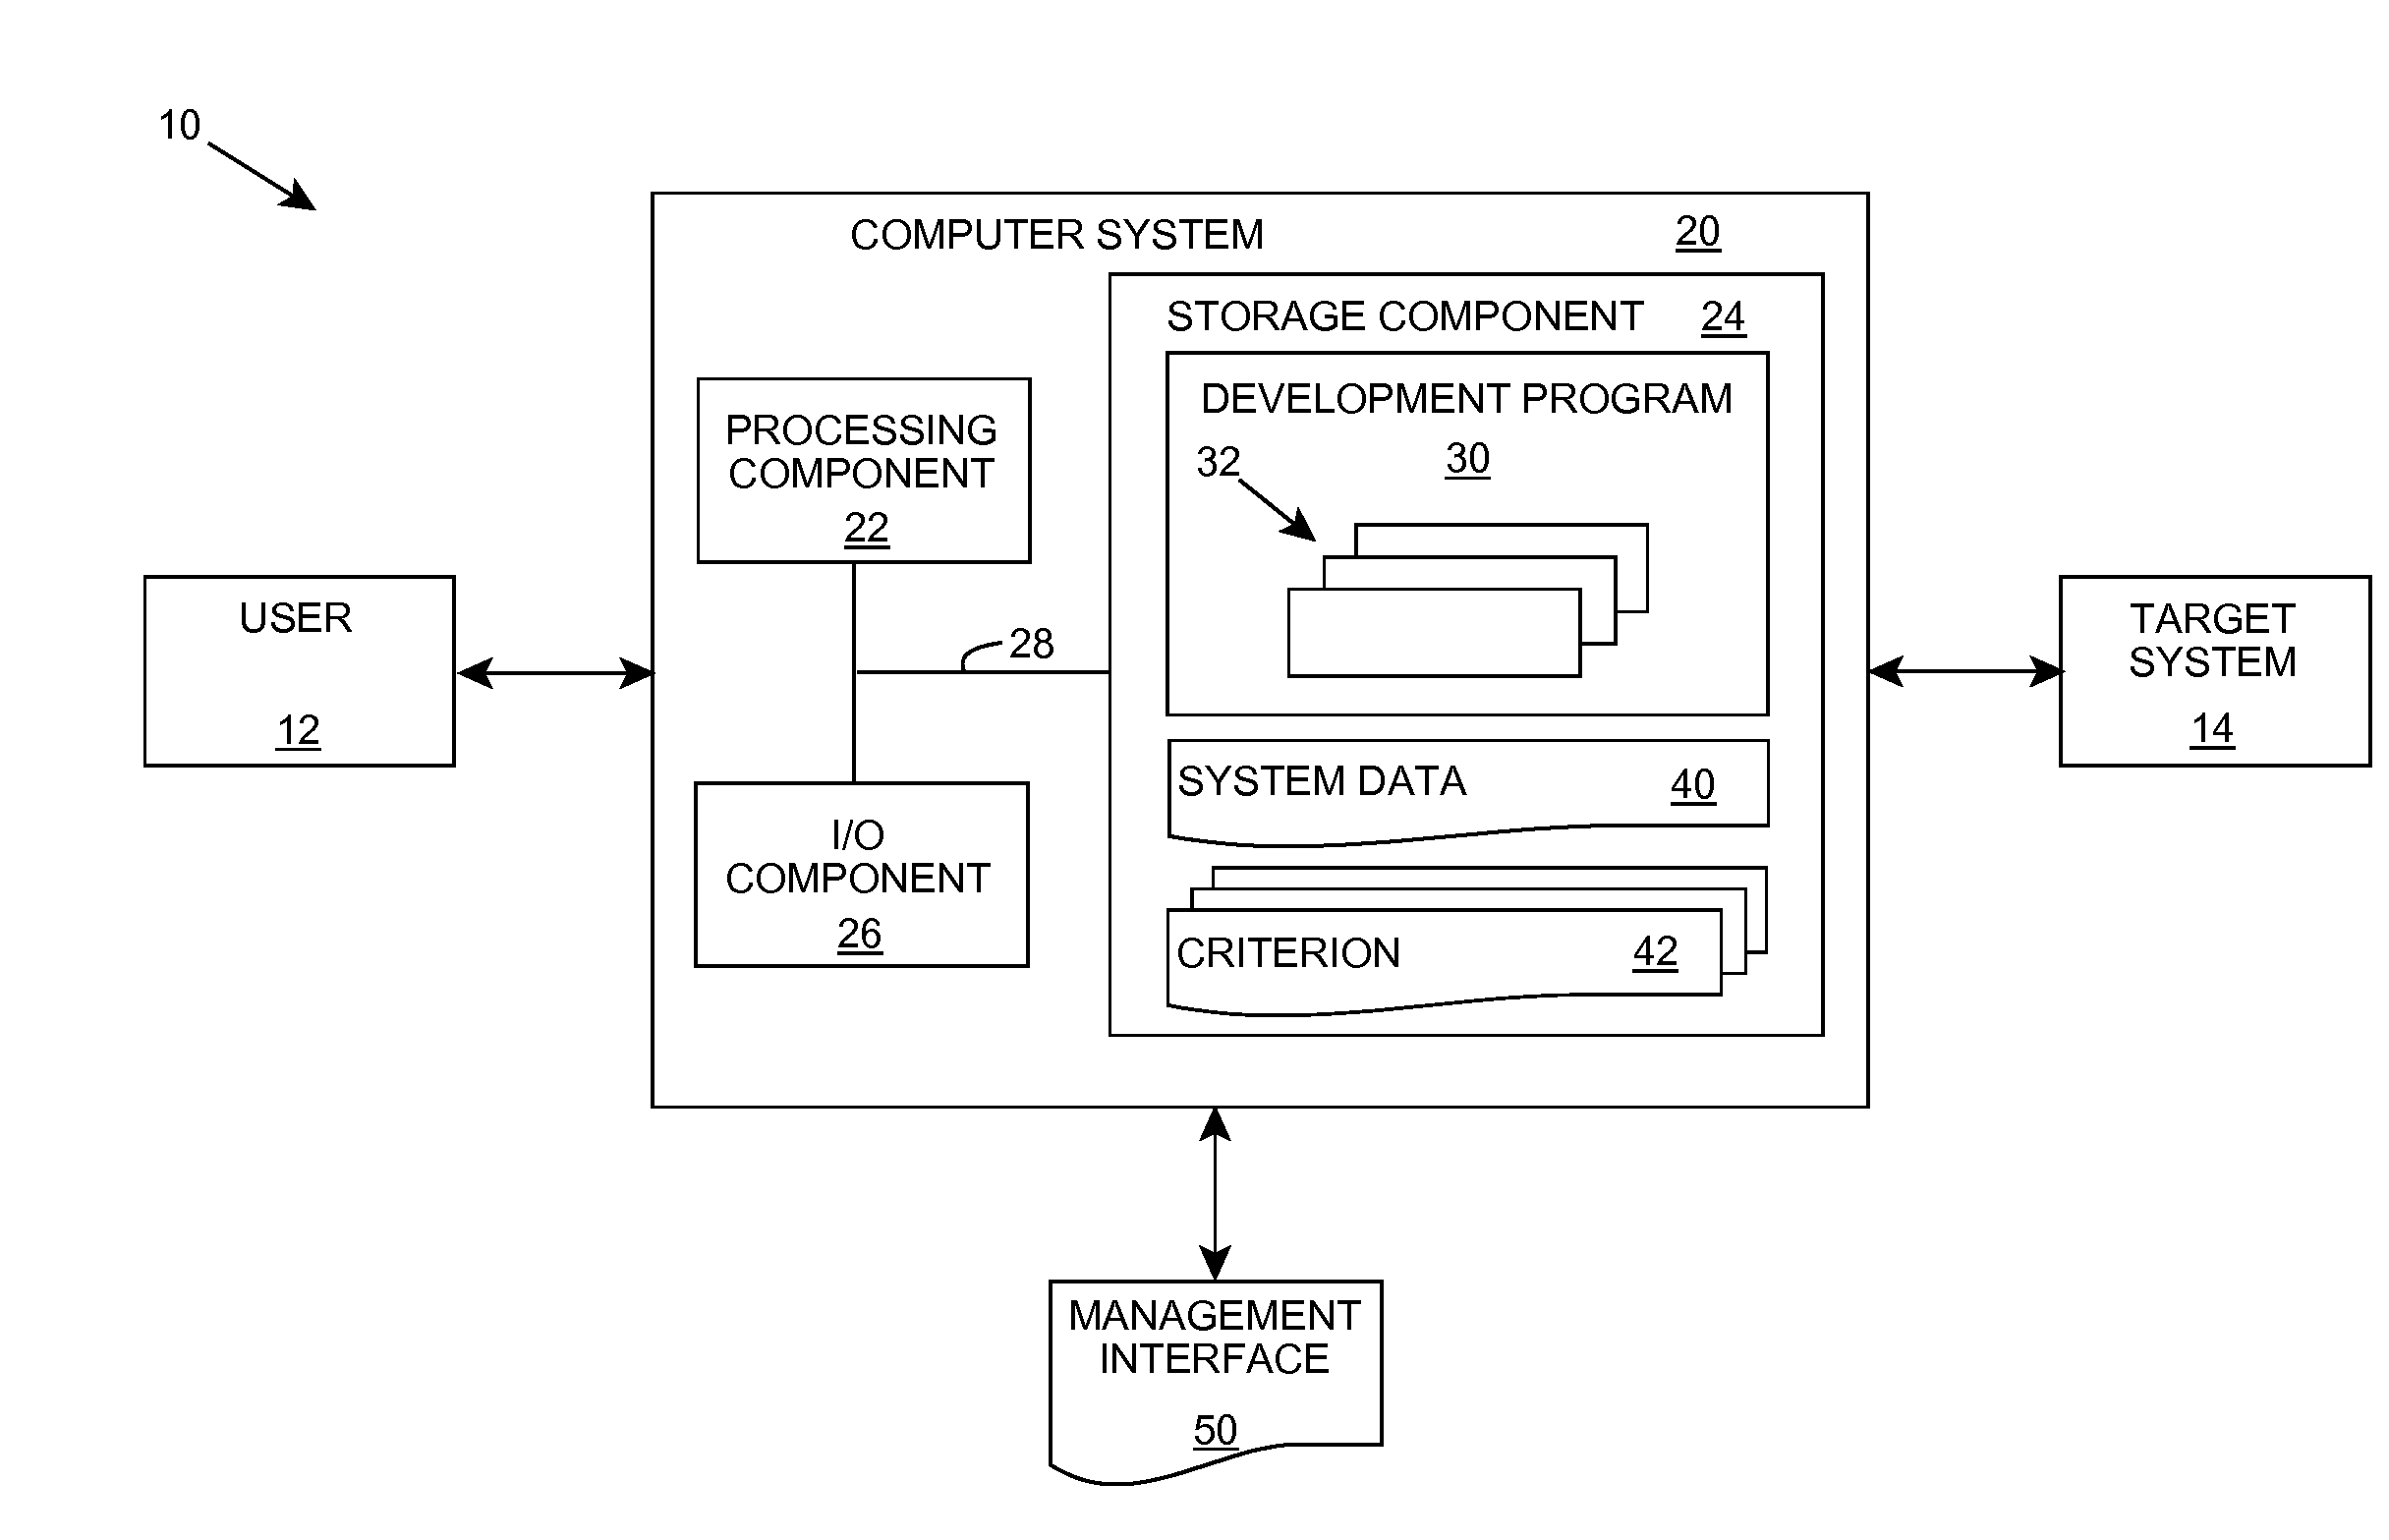
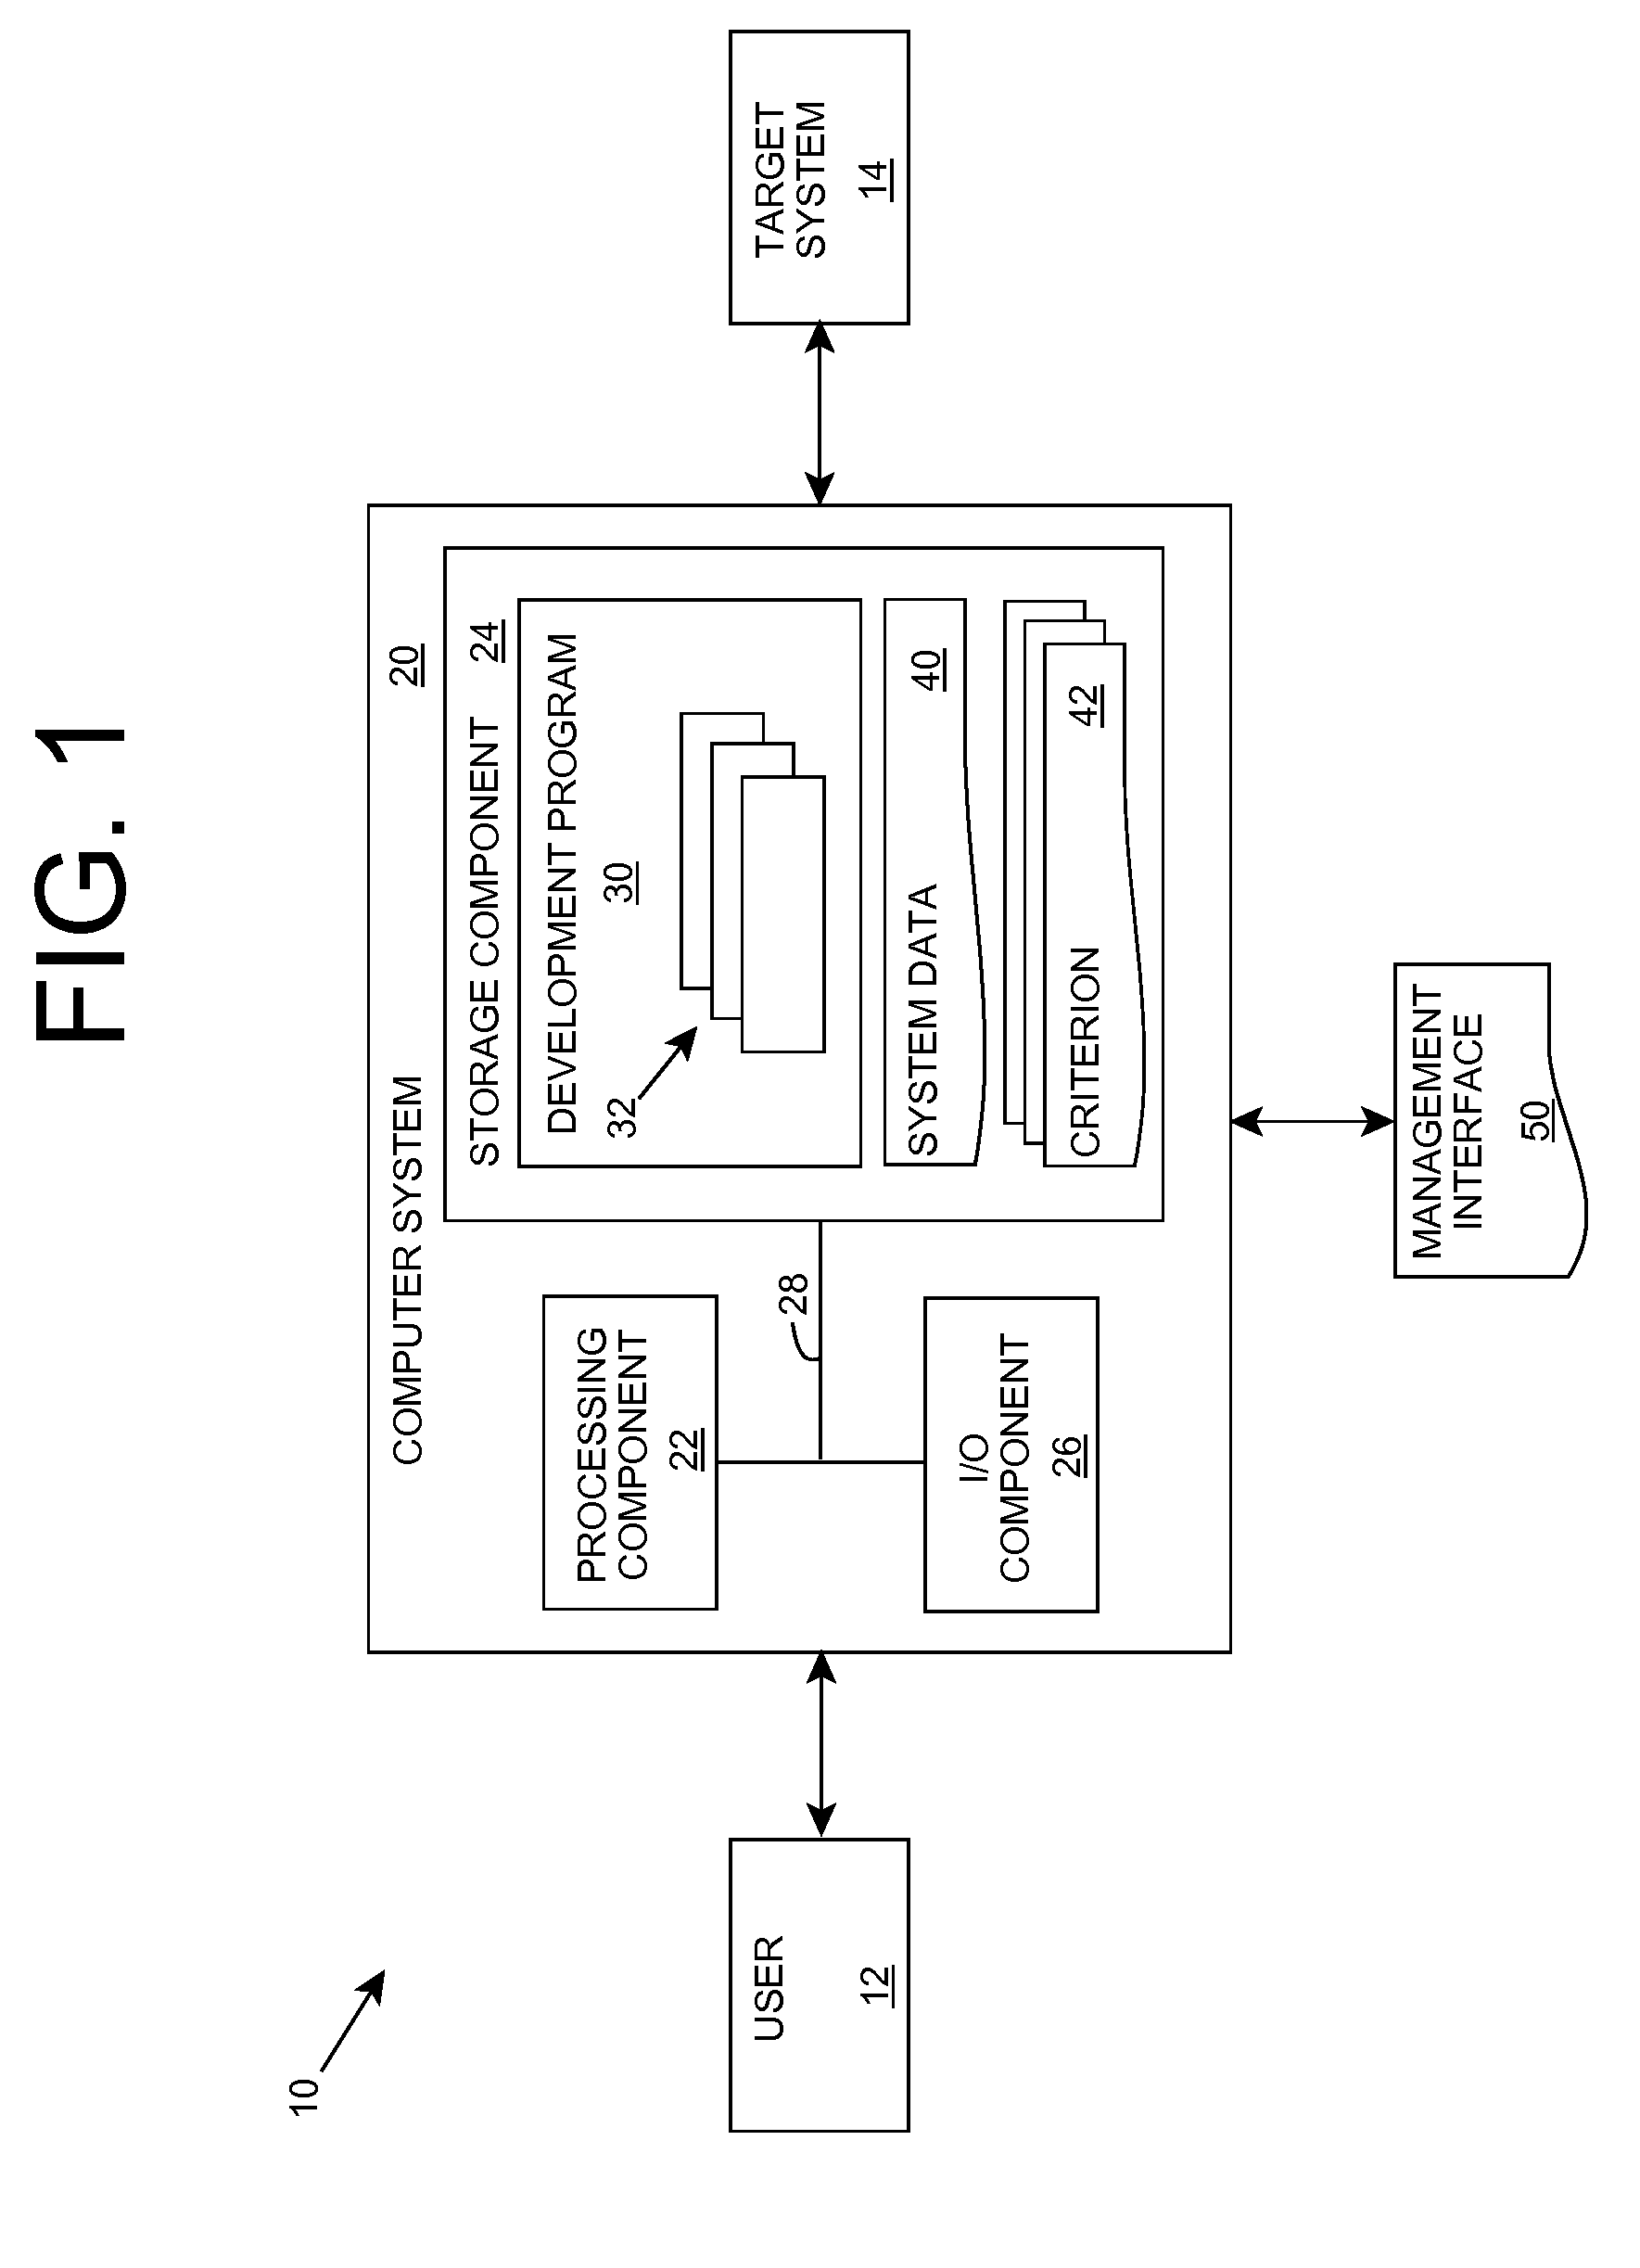
[0020]The inventors propose that certain types of data, such as data on a system being developed (e.g., created, maintained, and / or the like), may comprise a “Long Tail” distribution, in which the tail comprises a collection of lower priority issues that are not selected to be addressed prior to the release of a version of the system. As a result, previous approaches to identifying issues to be addressed prior to the deployment of a version of the system may fail to provide a maximum possible return on investment (ROI). To address this situation, aspects of the invention provide a solution that utilizes a Venn diagram to enable user(s) to interactively explore the issues from multiple perspectives simultaneously. Utilizing the Venn diagram, user(s) will be enabled to make more richly informed comparisons, judgments, trade-offs, and / or the like.

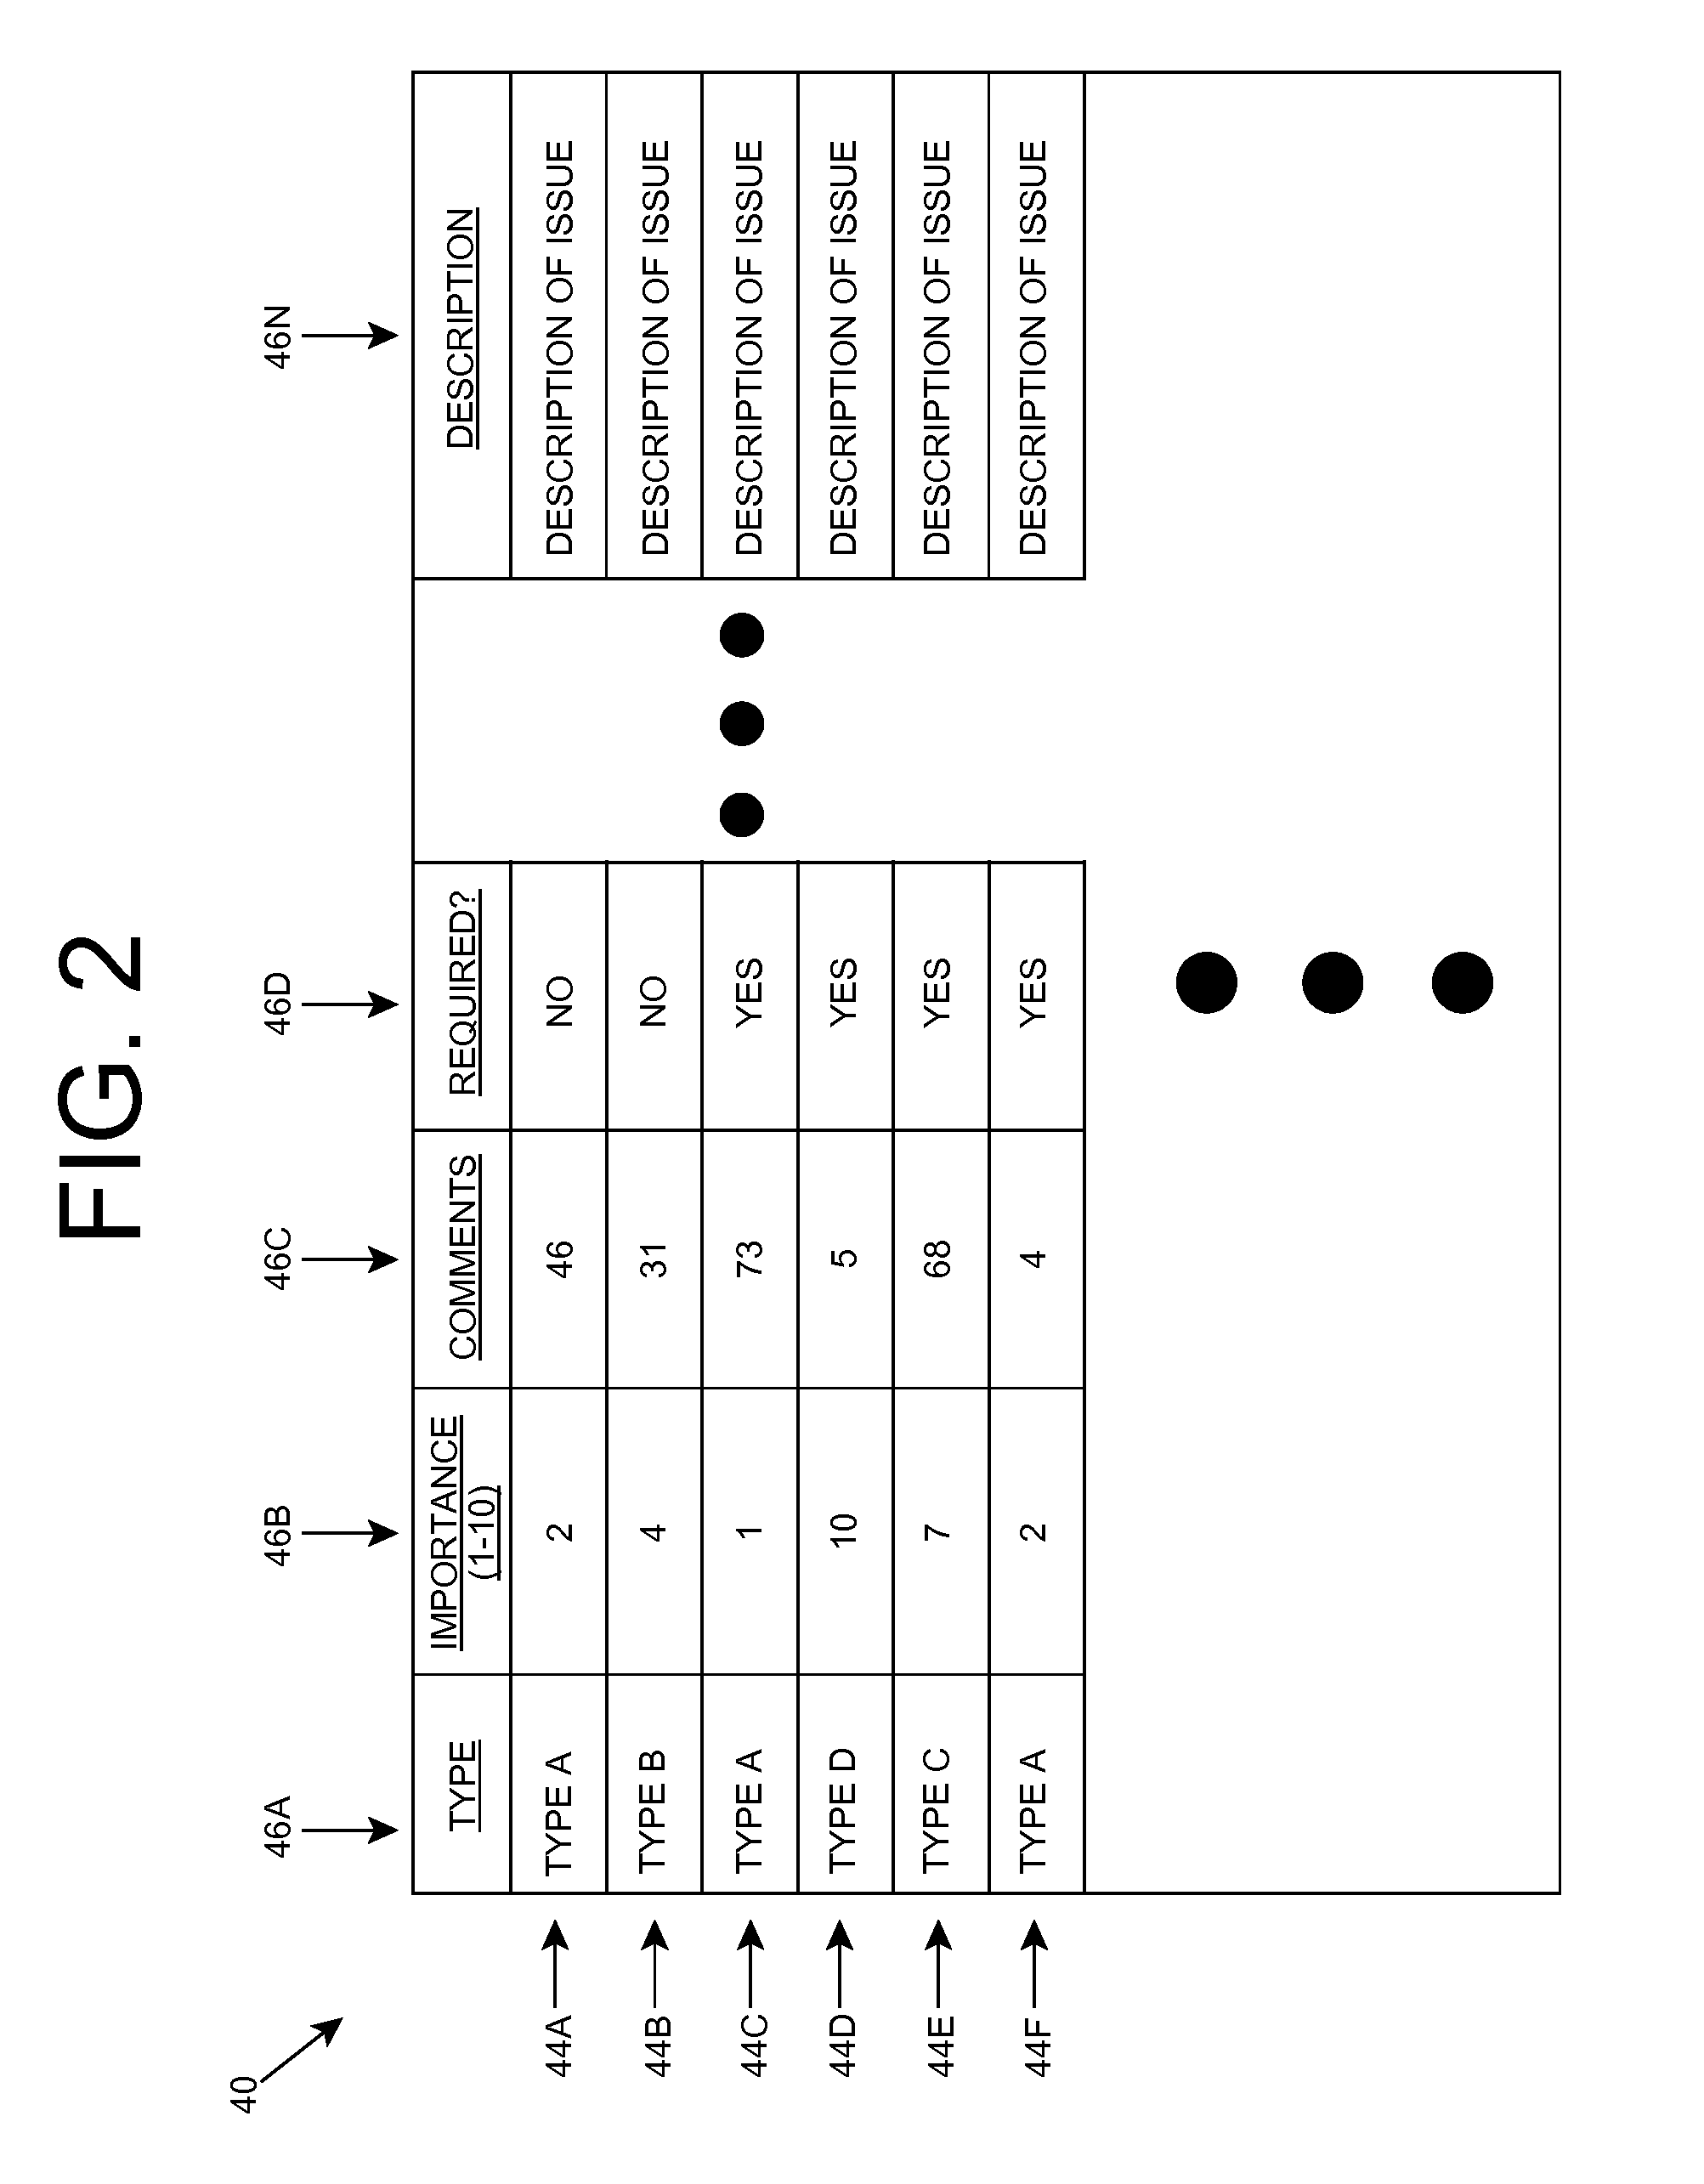
[0021]In an illustrative embodiment, the invention is described in conjunction with system data for a target system being developed. For exam...


PUM


Abstract

A solution that displays ranked categories of data in a Venn diagram is provided. In particular, entries of data are assigned to one of a plurality of categories based on one or more attributes of the entries. The categories are then ranked for each of one or more criteria. Each criterion can use a unique set of the attributes to rank the categories. A Venn diagram is generated that includes a circle for each criterion and displays the rankings of the various categories using one or more visual representations of each category. For example, the rankings can be displayed using tag clouds for each category that are placed in each circle. Two or more circles can overlap in which case categories that have one or more entries that meet all the corresponding criteria can be displayed in the overlapping portion of the circles.

Description

TECHNICAL FIELD[0001]The disclosure relates generally to user interfaces, and more particularly, to a user interface for viewing system data.BACKGROUND ART[0002]“The Long Tail” is a phrase that has been used to describe a particular type of statistical distribution. In The Long Tail distributions, a high frequency / amplitude population is followed by a low frequency / amplitude population, with the low frequency / amplitude population making up the majority of the distribution. Such a distribution occurs in some business environments. For example, a company may offer numerous products that are in low demand and / or have a low sales volume. However, with a sufficiently large distribution channel, the cumulative sales volume / demand for these products may comprise a market share that rivals or exceeds the relatively fewer high demand / sales volume products offered by the company.[0003]In system development (e.g., information system development), various issues with respect to a system being d...

Claims


Application Information

Patent Timeline
Patent Type & Authority Applications(United States)
IPC IPC(8): G06K9/00
CPCG06F17/30554G06F17/3053G06Q10/10G06F16/24578G06F16/248
Inventor LI, JINMODIESKA, DAVID K.
Owner IBM CORP
Why Eureka
Try Eureka