Information visualization technology-based house property data visualization system

A technology of data and technology, applied in the field of real estate data visualization system, can solve problems such as poor interactivity, lack of mining ability, and chaotic data drawing, and achieve the effect of good mining ability, interactivity, and unified data drawing

Active Publication Date: 2012-01-25
ZHEJIANG UNIV OF TECH
View PDF2 Cites 41 Cited by
  • Summary
  • Abstract
  • Description
  • Claims
  • Application Information

AI Technical Summary

Problems solved by technology

[0014] In order to overcome the deficiencies of the existing real estate visualization technology, such as data rendering confusion, static display, lack of mining ability, and poor interactivity, the present invention provides an information-based Real estate data visualization system of visualization technology

Method used


Image

  • Information visualization technology-based house property data visualization system
  • Information visualization technology-based house property data visualization system

Examples


Embodiment Construction

[0036] The present invention will be further described below in conjunction with the accompanying drawings.

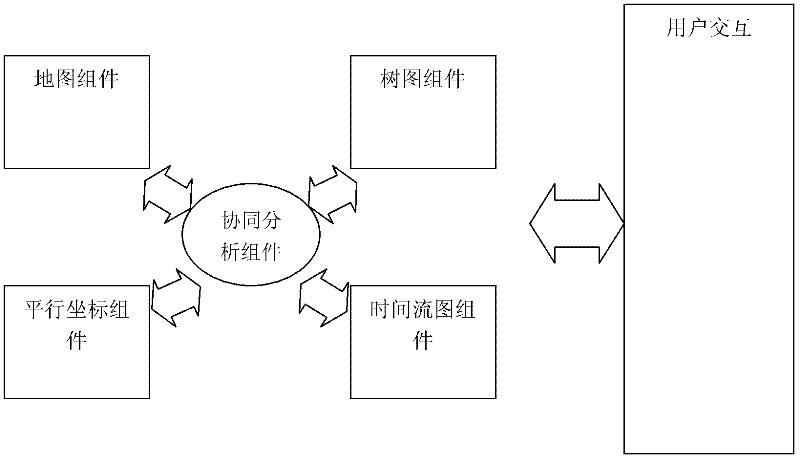
[0037] refer to figure 1 , a real estate data visualization system based on information visualization technology, the real estate data visualization system includes:

[0038] The real estate map visualization component is used to mark the actual geographical location of each real estate on the map according to the map and real estate geographic location data. Users can browse and query all real estate location information on the map, and specify certain real estate to highlight or hide them; In terms of map operation, users can arbitrarily zoom and move the map to view the detailed house location; when the user selects a real estate label, the map component presents the hidden information of the house in the form of a prompt box, and the hidden information includes selling price, opening time and area ;

[0039] The tree diagram visualization component is used to rep...


PUM


Abstract

The invention discloses an information visualization technology-based house property data visualization system, which comprises a premise map visualization component, a tree graph visualization component, a parallel coordinate visualization component, a time flow graph visualization component and a collaborative analysis component, wherein the premise map visualization component is used for labeling actual geographical positions of various on-sale premises on a map according to the map and the geographical position data of the premises; the tree graph visualization component is used for indicating a premise by a rectangular diamond, and showing a certain numeric data of a corresponding premise by the color or area of the rectangular diamond; the parallel coordinate visualization component is used for visualizing multi-dimensional data; the time flow graph visualization component is used for visualizing timing data by using a time flow graph; and the collaborative analysis component is used for closely connecting various visualization components and correspondingly displaying different visualization effects of selected data in other components in real time when a user performs different selection operation in different visualization components. The information visualization technology-based house property data visualization system has the advantages of uniform data drawing, dynamic display, and high mining capacity and interactivity.

Description

technical field [0001] The invention relates to information visualization and visual analysis technology intersecting multiple fields such as computer graphics, human-computer interaction and psychology, especially a real estate data visualization system. Background technique [0002] Information visualization is a new development of visualization technology. It extends visualization technology from the field of scientific computing to the field of large databases. By converting the data items in the database into the form of graphics and images, it can discover the internal connection and development law of the data. With the continuous increase in the capacity and complexity (such as dimensions) of data sets, the use of traditional data analysis and data mining tools for processing and analysis has become insufficient. Therefore, more effective ways to visually analyze data are needed. . Information visualization is the use of computer graphics and image processing techno...

Claims


Application Information

Patent Timeline
Patent Type & Authority Applications(China)
IPC IPC(8): G06F19/00
Inventor 梁荣华余乐伟孙国道何贤国
Owner ZHEJIANG UNIV OF TECH
Why Eureka
Try Eureka