Method and system for processing and displaying GIS (Geographic Information System) point locations of urban management events

An event and urban management technology, applied in data processing applications, special data processing applications, geographic information databases, etc., can solve problems such as slowness and browser freezes

Inactive Publication Date: 2021-05-28
CITY CLOUD TECH HANGZHOU CO LTD
View PDF6 Cites 1 Cited by
  • Summary
  • Abstract
  • Description
  • Claims
  • Application Information

AI Technical Summary

Problems solved by technology

[0005] The embodiment of the present application provides a method and system for processing and displaying the GIS points of urban management events, so as to at least solve the problem that tens of thousands of event latitudes and longitudes need to be calculated and aggregated on the user browser when visualizing the urban management business, so it is very difficult It is easy to cause the browser to freeze and slow down

Method used


Image

  • Method and system for processing and displaying GIS (Geographic Information System) point locations of urban management events
  • Method and system for processing and displaying GIS (Geographic Information System) point locations of urban management events
  • Method and system for processing and displaying GIS (Geographic Information System) point locations of urban management events

Examples


Embodiment 1

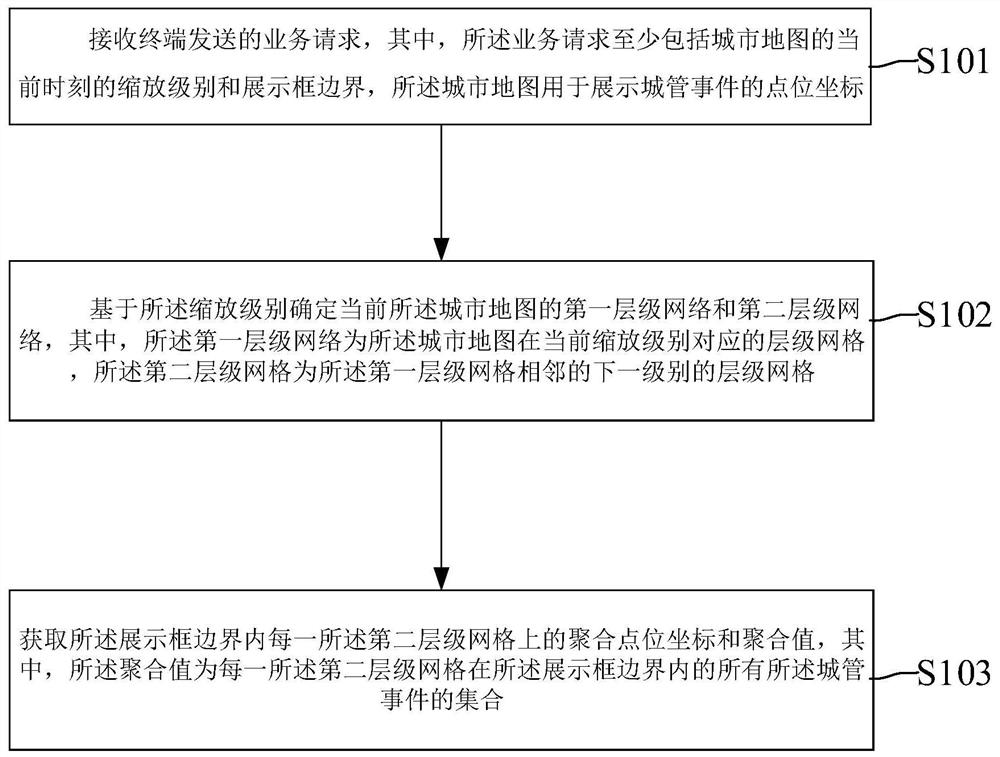
[0047] see figure 1 , shows the method for processing the GIS points of urban management events in one embodiment of the present invention, the method is applied on the server, including steps 101-step 103:

[0048] Step 101-Step 103:

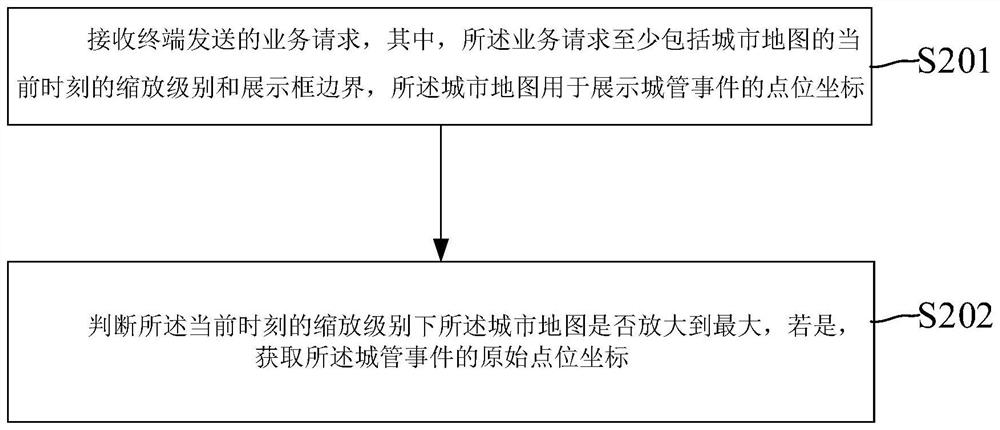
[0049] Step 101, receiving a service request sent by a terminal, wherein the service request includes at least the current zoom level and display frame boundary of the city map, and the city map is used to display point coordinates of urban management events;

[0050] Step 102: Determine a first-level network and a second-level network of the current city map based on the zoom level, wherein the first-level network is a level grid corresponding to the city map at the current zoom level, and the The second-level grid is a next-level hierarchical grid adjacent to the first-level grid;

[0051] Step 103, obtaining the aggregated point coordinates and aggregated values ​​on each of the second-level grids within the boundary of the display frame, ...

Embodiment 2

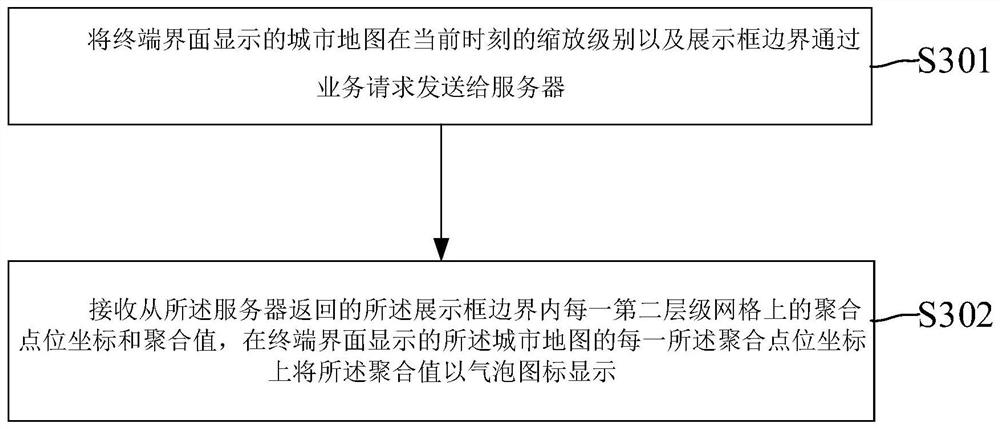
[0085] see image 3 , this embodiment also provides a method for displaying GIS points of urban management events, the method comprising steps 301 to 302:

[0086] Step 301, sending the zoom level of the city map displayed on the terminal interface at the current moment and the border of the display frame to the server through a business request;

[0087] Step 302, receiving the aggregated point coordinates and aggregated values ​​on each second-level grid within the border of the display frame returned from the server, and displaying each aggregated point on the city map on the terminal interface The aggregated values ​​are displayed as bubble icons on the coordinates.

[0088] In this example, see Figure 7 , when the zoom level of the map is less than 18, display the aggregated value as bubble text, in Figure 7 , the map is zoomed in at level 16, and three bubble icons are displayed on the city map, and the values ​​inside the bubble icons are 2, 3, and 5 from left to r...

Embodiment 3

[0123] see Figure 10 , the embodiment of the present application provides a system for the server to process GIS points of urban management events. The system is used to implement the above embodiments and preferred implementation modes, and those that have already been described will not be repeated. Although the devices described in the following embodiments are preferably implemented in software, implementations in hardware, or a combination of software and hardware are also possible and contemplated.

[0124] Specifically, the system includes:

[0125] A preprocessing module 501, configured to divide the city map into a plurality of hierarchical grids, and correspond each of the hierarchical grids to at least one map zoom level;

[0126] An acquisition module 502, configured to acquire point coordinates of urban management events in the city map, and calculate the number of point coordinates contained in each level grid;

[0127] The calculation module 503 is configured...


PUM


Abstract

The invention relates to a method and a system for processing and displaying GIS point locations of urban management events by a server. The method comprises the following steps: receiving a service request sent by a terminal; determining a first-level network and a second-level network of the current city map based on the zoom level; obtaining an aggregation point position coordinate and an aggregation value on each second-level grid in the display frame boundary, wherein the aggregation value is a set of all the urban management events of each second-level grid in the display frame boundary. According to the method and system, point location calculation is carried out from the front end to the server, and the browser directly requests the aggregated value or the original point location according to the map zooming level, so that the rendering calculation time of the front end of the browser is greatly shortened.

Description

technical field [0001] This application relates to the field of urban management, in particular to a method and system for processing and displaying GIS points of urban management events. Background technique [0002] Urban management incidents refer to issues that are not fixed in the city and are closely related to human activities, such as road occupation, posting of small advertisements, road collapse, etc. These incidents have the characteristics of unfixed locations, random occurrences, and various types. Therefore, these events are received in various ways through the city management information system, and a visual way of analyzing and operating events on the browser is provided for the personnel of the urban management department. Events reported to the city management information system will include GIS point information (latitude and longitude). For the visual display of events, the city management information system usually uses front-end technology to locate the...

Claims


Application Information

Patent Timeline
IPC IPC(8): G06F16/29G06Q50/26
CPCG06F16/29G06Q50/26
Inventor 郁强薛炜孙伟东
Owner CITY CLOUD TECH HANGZHOU CO LTD
Why Eureka
Try Eureka