[0006] The present invention is a
user interface for an
electronic trading system that allows a remote trader to view trends in the orders for an item, and provides the trading information in an easy to see and interpret graphical format. The
user interface of the present invention operates in a
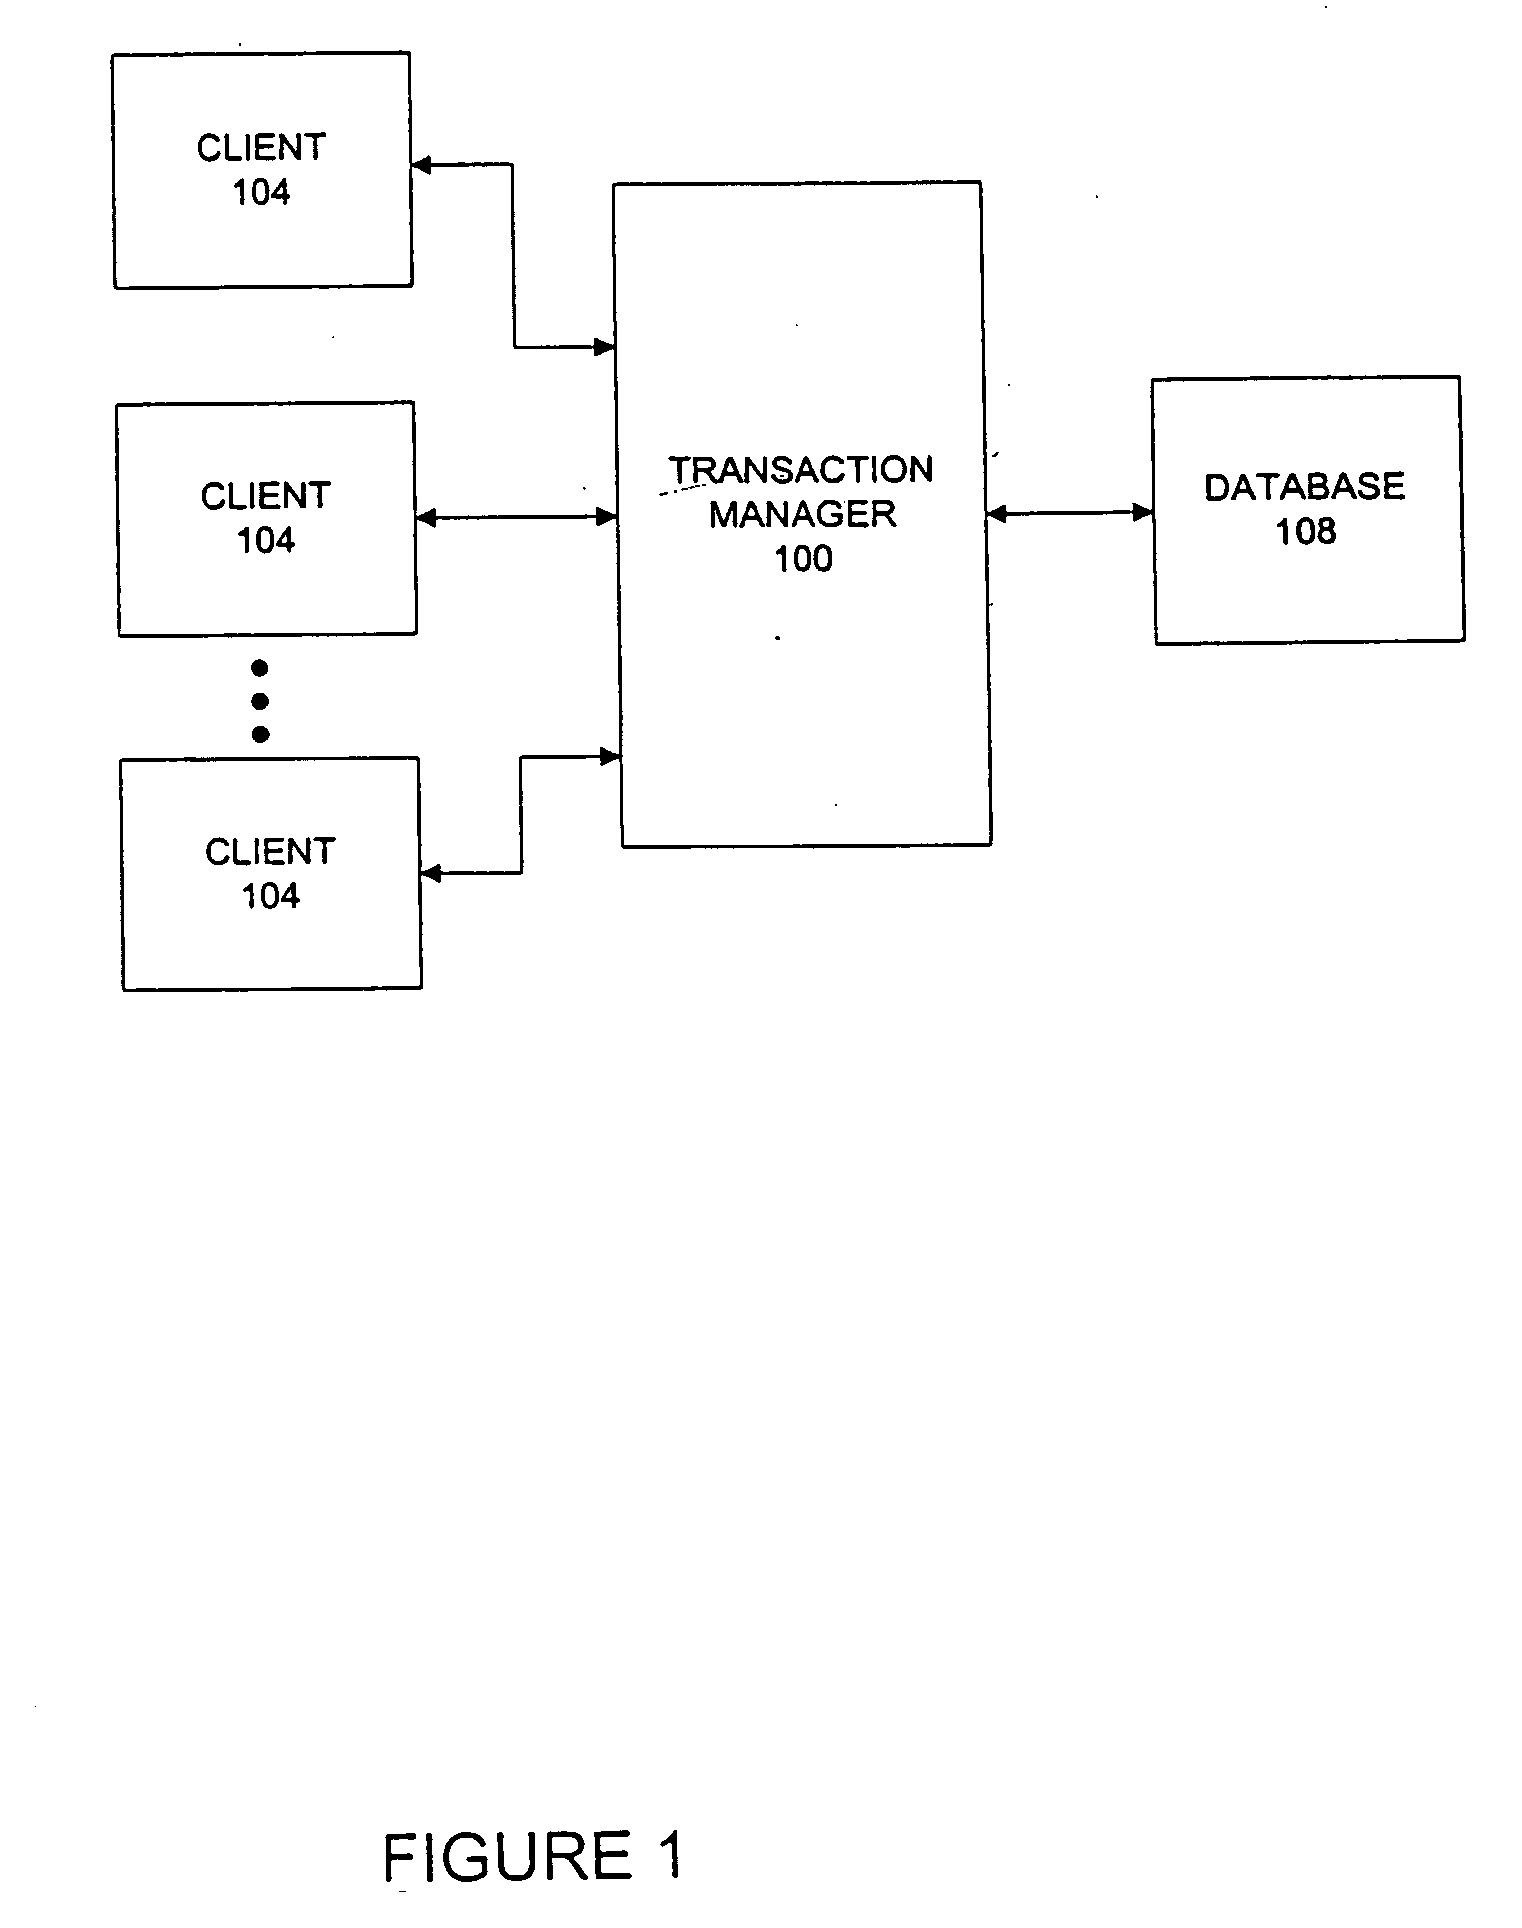
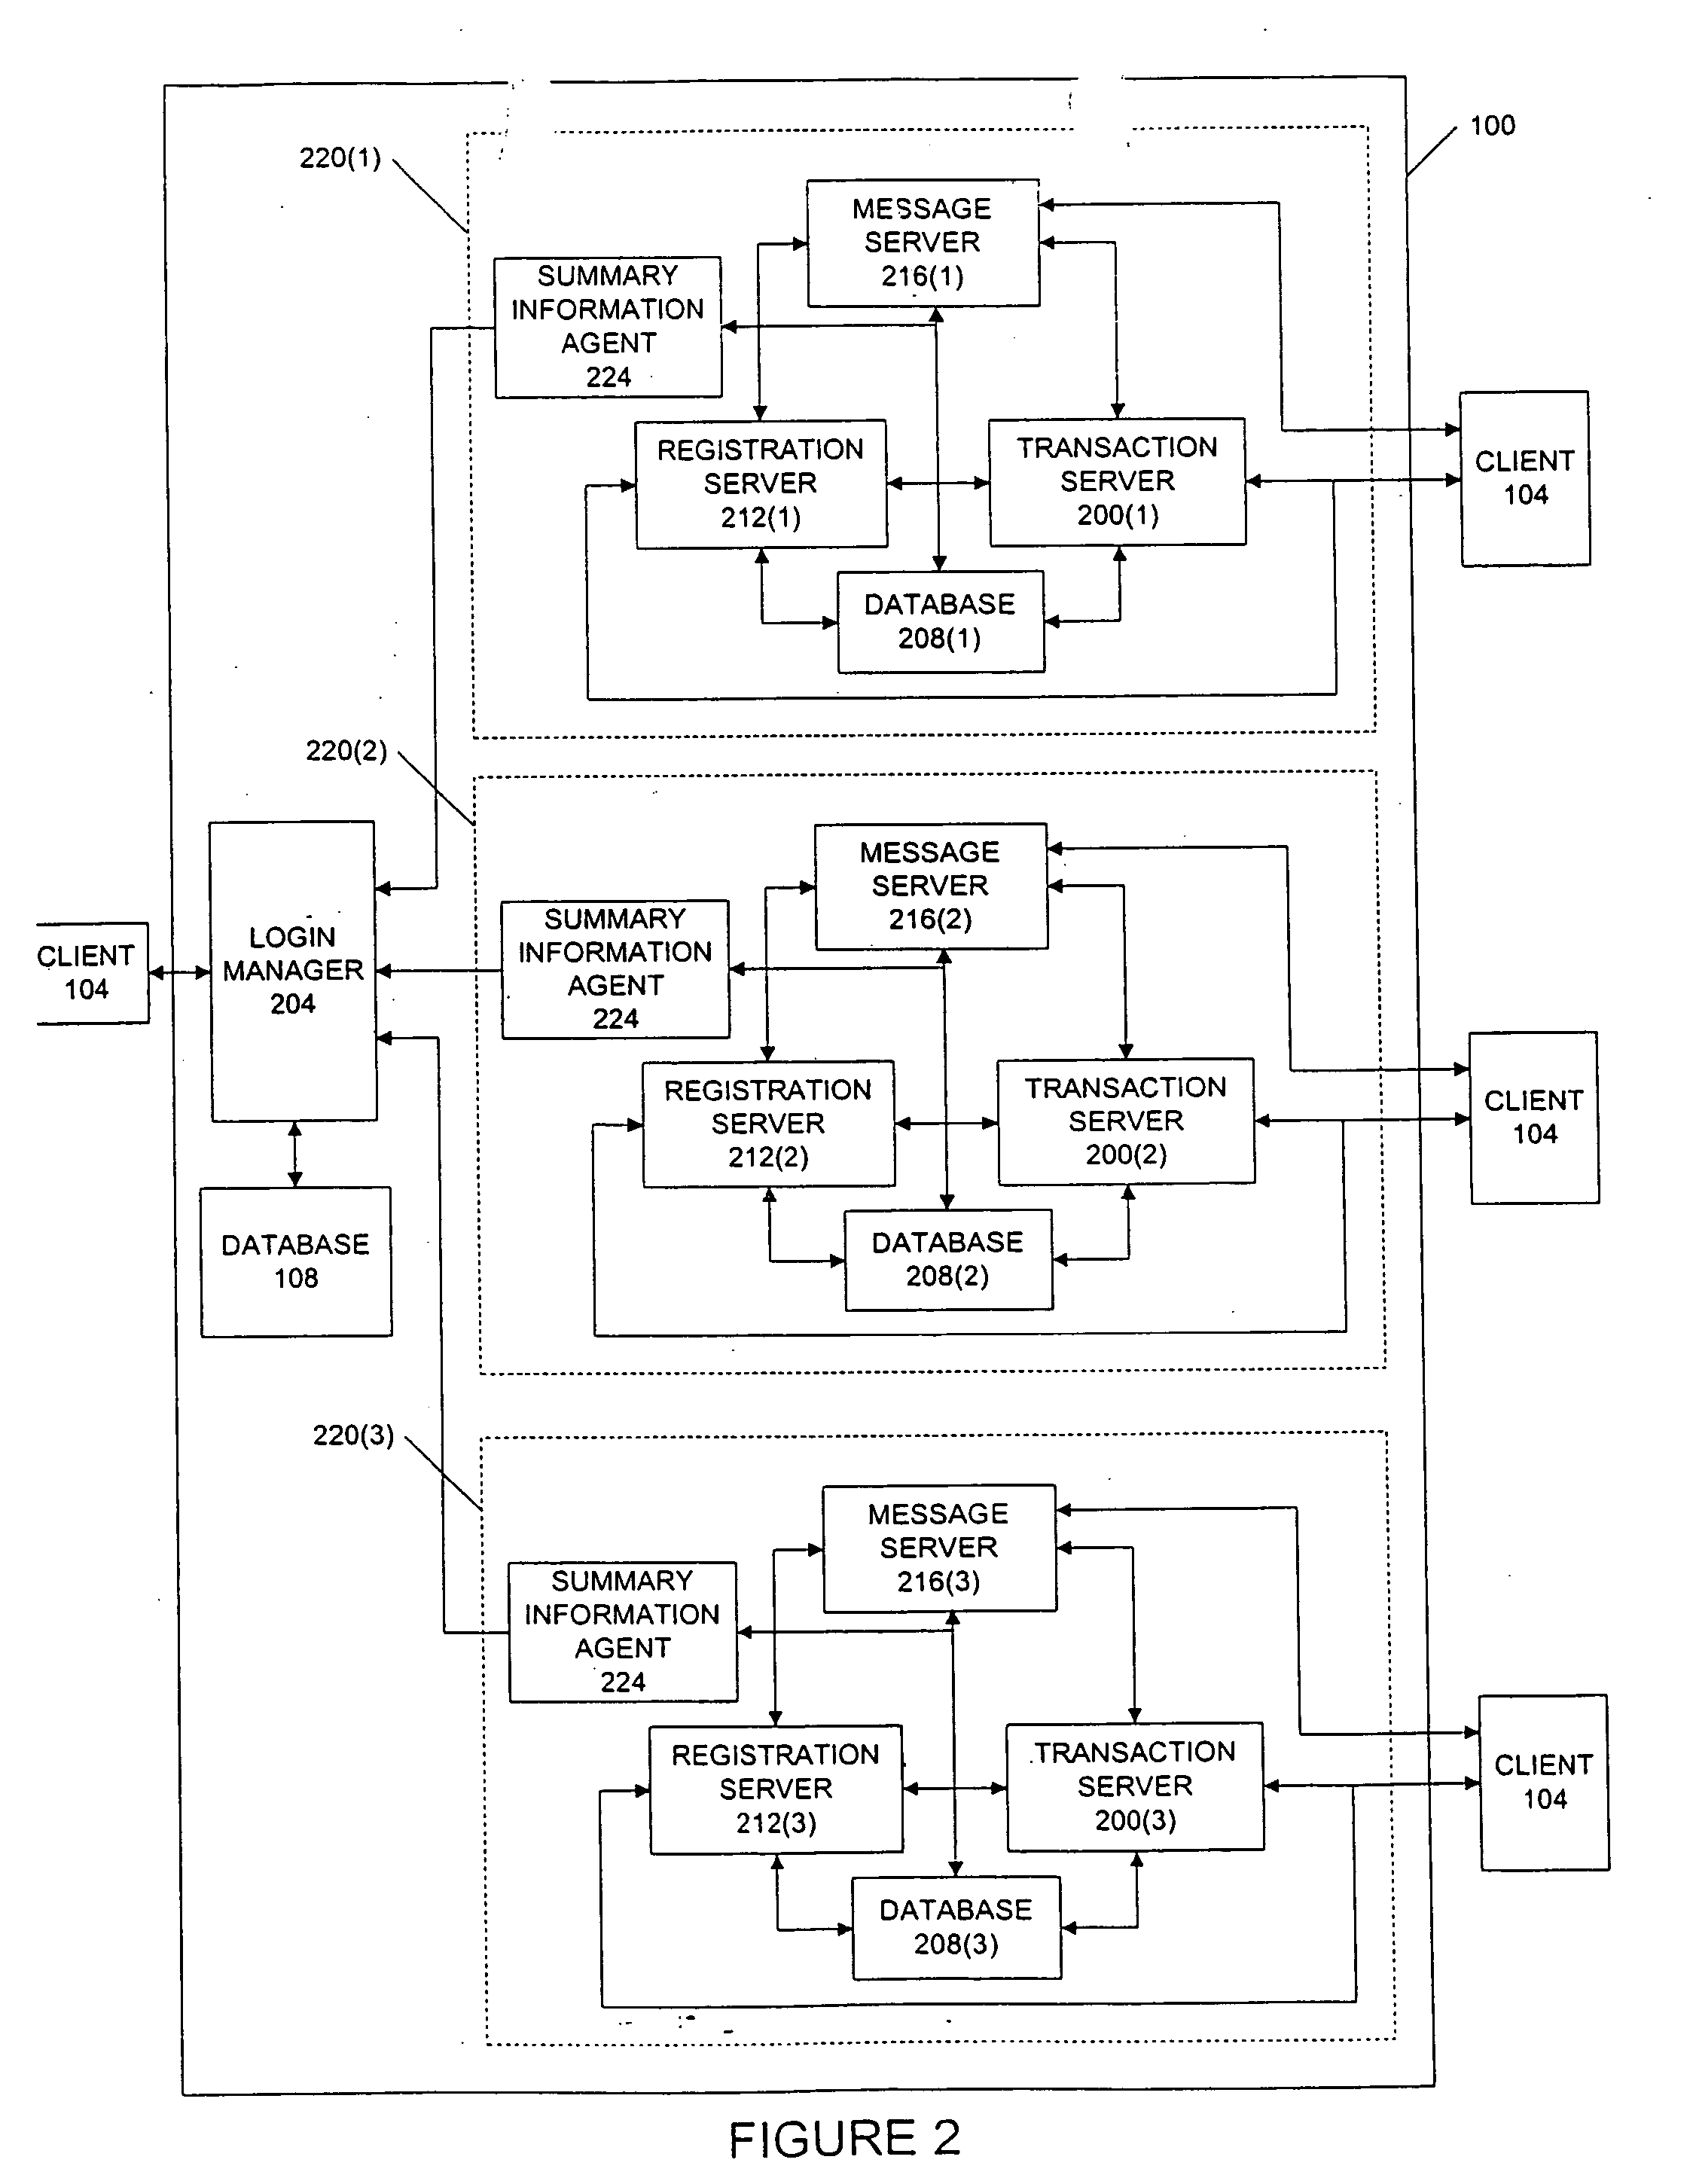
system in which individual traders place orders including bids and offers, on remote client terminals, and this information is routed to a transaction
server. The transaction server receives order information from the remote terminals, matches a bid for an item to an offer for an item responsive to the bid corresponding with the offer, and communicates outstanding bid and offer information back to the client terminals. Thus, in accordance with the present invention, each client terminal displays all of the outstanding bids and offers for an item, in contrast to the conventional systems and methods in which only the highest bid and lowest offer were known to the individual trader. This allows the trader to view trends in orders for an item, and thus better enables the trader to anticipate demand for the item.
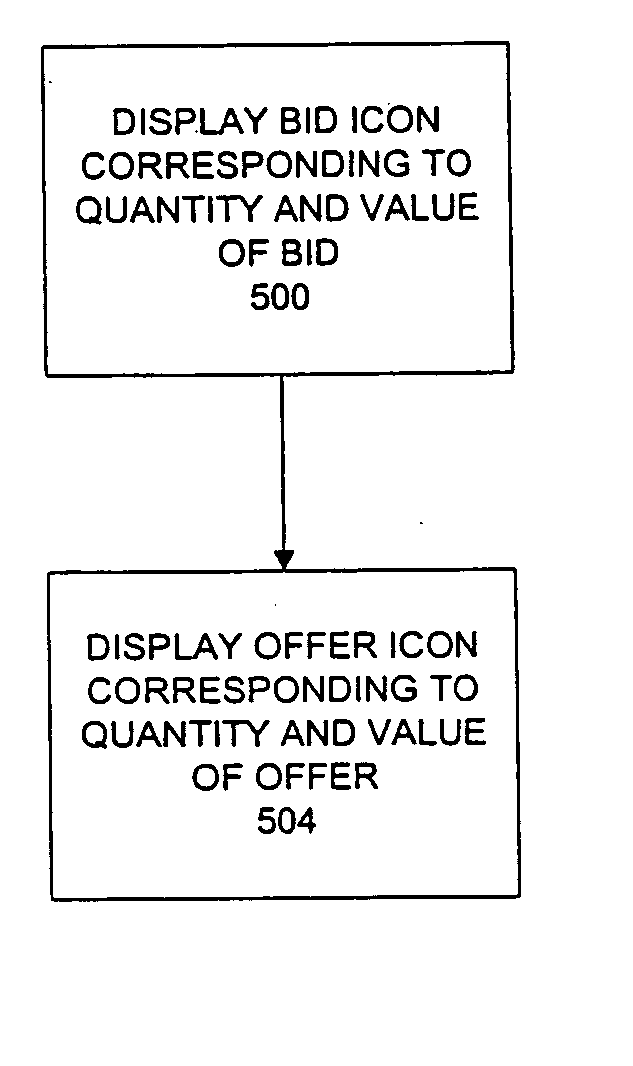
[0008] The user interface of the present invention presents this information in an intuitive format, allowing the trader to make informed decisions quickly. In a priority view embodiment, bid and offer icons are displayed corresponding to an axis of values. This results in the bid icons being displayed on the lower portion of the screen and the offer icons being displayed on the upper portion of the screen. The trader is able to discern immediately the number and volume of bids and offers outstanding for the item and their difference in value. The bids and offers are preferably displayed in different colors, shapes, or other visual characteristics, further enhancing the trader's ability to quickly ascertain the current state of the market. The screen is updated frequently to display the most recent bids and offers. In one embodiment, the icons are formed having an edge which is angled toward the axis of values. When all outstanding offers and bids are displayed, the arrangement of icons naturally forms the edges of a triangle that points to the value differential at the axis of values. In yet another embodiment, the trader's own bids and offers are displayed in a first color or other visual characteristic, and the bids and offers of other traders are displayed in a second color or visual characteristic. This allows the trader to quickly determine his or her relative position in the marketplace. Finally, in a preferred embodiment, a size of the icons represents the quantity of the bid or offer, allowing an easy visual means of determining the relative quantities each bid and offer represent.
[0009] In a value / quantity view embodiment, an axis of values and an axis of quantities are used to determine the location of the bid and offer icons. The icons in this embodiment are markers or tokens and provide a different
look and feel to the trader. Providing alternate views allow a trader to select a view with which the trader is most comfortable trading.
[0010] A value quantifying analytic is displayed in a further embodiment with respect to the value axis at a location corresponding to the current value which the analytic represents. The analytic is preferably displayed as a marker called an action line, in a color or other visual characteristic different from the other characteristics used to represent other objects being displayed. The action line is selected by each individual trader and can reflect value-to-earning ratio, volatility, volume of sales, or any other metric the trader designs, or can be selected from a listed of predetermined
metrics. The action line responds to changes in the data it measures, updating in essentially real time. The action line allows the trader to immediately determine the current valuation of the item relative to the trader's own valuation of the item. As the offers or bids approach the action line, the trader is prepared to complete a transaction in accordance with the trader's own valuation.
[0012] An alternate embodiment provides a trading pit view that displays trader icons for each trader and positions the trader icons reflective of the
activity level of the trader. Floor brokers and other bystanders are also displayed and identified to allow the trader to understand at a glance the respective positions and activity of all users currently connected to the transaction server for that trading pit. Selecting a trader icon provides information regarding the trader and can open up a window to allow the traders to communicate with each other using one or more methods including
electronic mail,
text chat or communication by voice over a
network connection. The trading pit view allows the remote trader to immediately ascertain whom the trader is trading against, how active they are, and allows the trader to better anticipate the market.

