EMS graphical dynamic menu display method based on human-computer interface user behavior analysis

A technology of behavior analysis and man-machine interface, applied in the input/output process of data processing, instruments, electrical digital data processing, etc., can solve the problem of ineffective utilization and mining of behavior habit data, and improve the feeling of daily operation , Improve work efficiency and facilitate use

Active Publication Date: 2014-01-22
STATE GRID CORP OF CHINA +1
View PDF3 Cites 9 Cited by
  • Summary
  • Abstract
  • Description
  • Claims
  • Application Information

AI Technical Summary

Problems solved by technology

[0003] The existing graphic display system of EMS only draws and displays the existing graphic files, but does not effectively use and mine the behavi

Method used


Image

  • EMS graphical dynamic menu display method based on human-computer interface user behavior analysis
  • EMS graphical dynamic menu display method based on human-computer interface user behavior analysis

Examples


Embodiment Construction

[0033] The specific embodiments of the present invention will be further described in detail below in conjunction with the accompanying drawings.

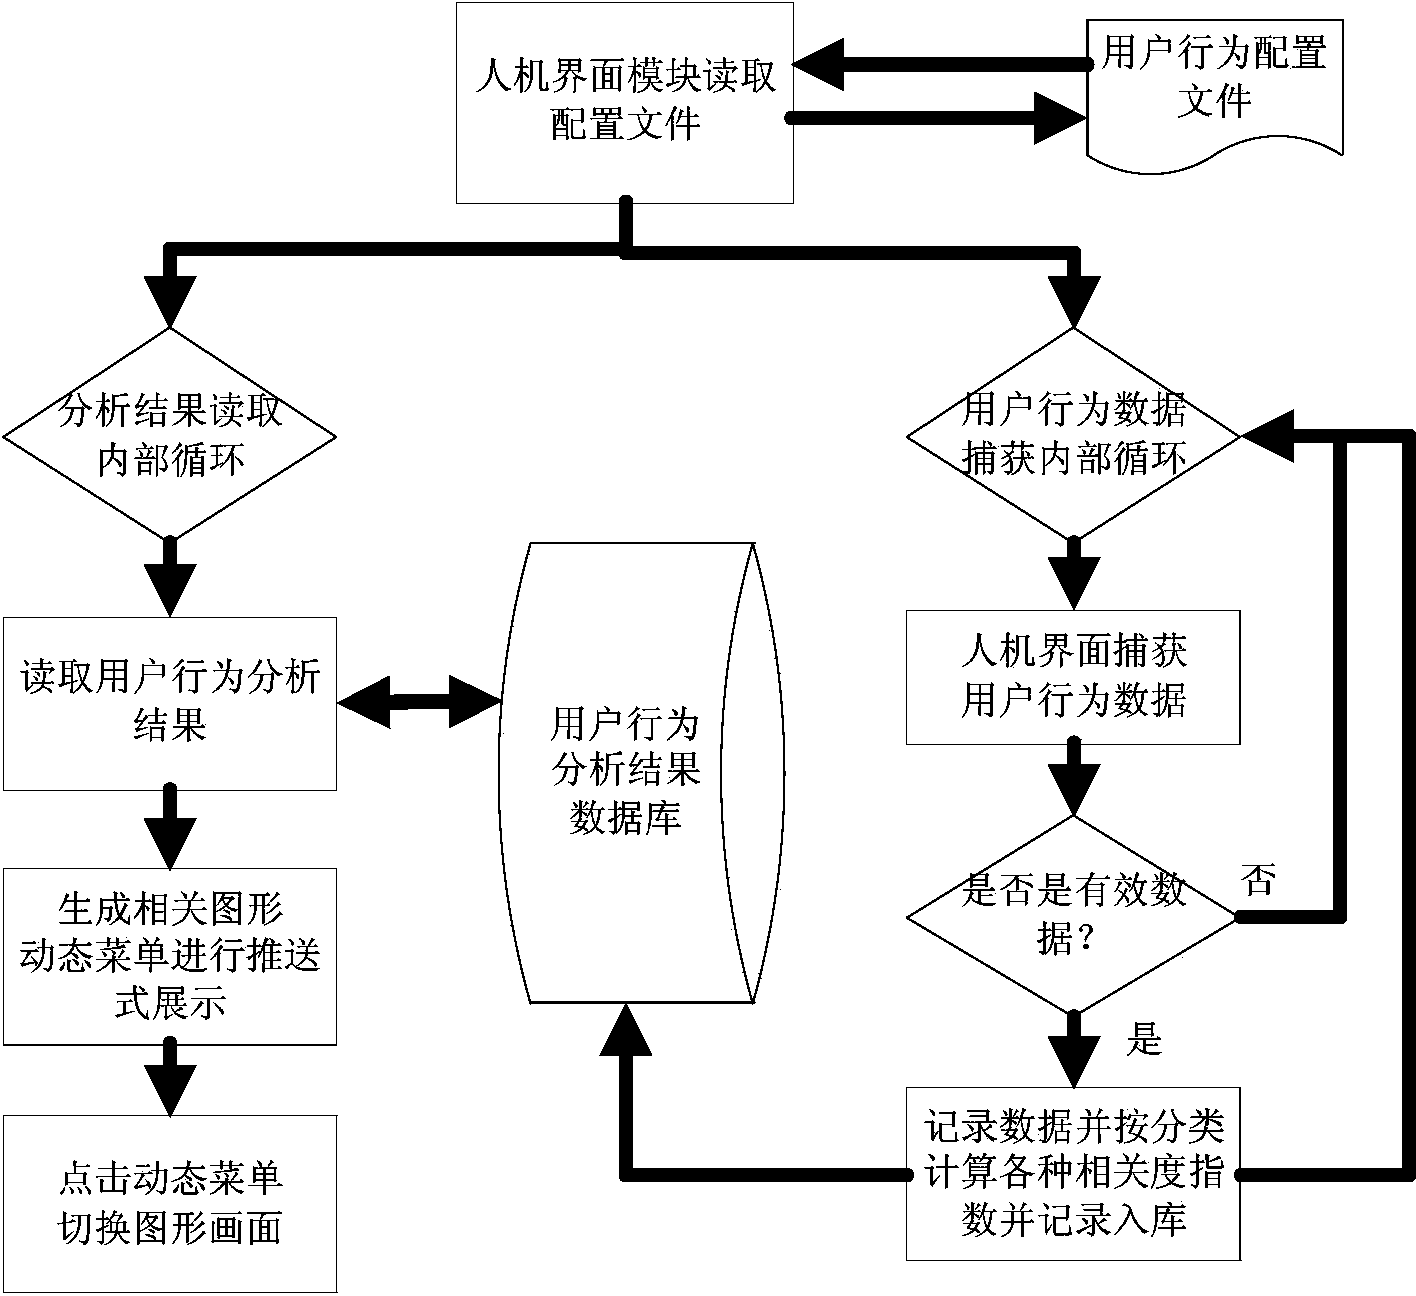
[0034] Such as figure 1 as shown, figure 1 A flow chart of the method for collecting, analyzing and displaying human-computer user behavior; including the following:

[0035] Step 1: The user behavior configuration file is read into the man-machine interface module as application configuration information required for obtaining and analyzing the collected user behavior data.

[0036] The user behavior configuration file includes: page effective time threshold, upper limit of the number of dynamic menu items, graphics file exclusion list and each dynamic menu text color, etc., through the user behavior configuration file to form a record, analysis and display of user behavior and related graphics internal relationships.

[0037] The effective time threshold of the page is used as a judging condition for recording and analyzing wh...


PUM


Abstract

The invention provides an EMS graphical dynamic menu display method based on human-computer interface user behavior analysis. The method includes allowing a system to read user behavior configuring files; acquiring user behavior data in real time; determining whether the user behavior data is valid or not; storing and analyzing the data to form a user behavior analyzing result data set; storing the user behavior analyzing result data set; allowing the system to read user behavior analyzing results, and displaying the user behavior analyzing results through dynamic menus. According to the method, in daily usage of an EMS human-computer interface, effective graphical information with high-degree correlation and page quick portal links are provided to users in a dynamic-menu manner, user experience on daily operating is improved, daily schedule efficiency is improved, and system intelligentization is shown.

Description

technical field [0001] The invention relates to a method in the technical field of artificial intelligence and graphic display in electric power systems, in particular to an EMS graphic dynamic menu display method based on man-machine interface user behavior analysis. Background technique [0002] EMS (Energy Management System, Energy Management System) is a complex power system, the quality of the system directly affects the development of advanced application software on the EMS and the success or failure of the entire system. From a functional point of view, the EMS graphics system mainly includes: development and production system diagrams, plant and station diagrams, and various application screens; establish network topology through the screens, establish mathematical modules required for state estimation, dispatcher training systems, etc.; The screen data on the screen is connected with the database to automatically produce the above data information, and provide tabl...

Claims


Application Information

Patent Timeline
IPC IPC(8): G06F3/0482
Inventor 孙鹏颜自坚刘晓梅朱桂英张鸿
Owner STATE GRID CORP OF CHINA
Why Eureka
Try Eureka