Visual display method of power distribution network fault positioning based on power grid GIS (geographic information system)

A technology for distribution network faults and distribution automation, which is applied in the directions of fault location, fault detection by conductor type, information technology support system, etc., to achieve the effect of improving management level

Inactive Publication Date: 2017-06-13
NARI TECH CO LTD +1
View PDF9 Cites 15 Cited by
  • Summary
  • Abstract
  • Description
  • Claims
  • Application Information

AI Technical Summary

Problems solved by technology

[0004] The purpose of the present invention is to overcome the problem in the prior art that it is

Method used


Image

  • Visual display method of power distribution network fault positioning based on power grid GIS (geographic information system)

Examples


Embodiment Construction

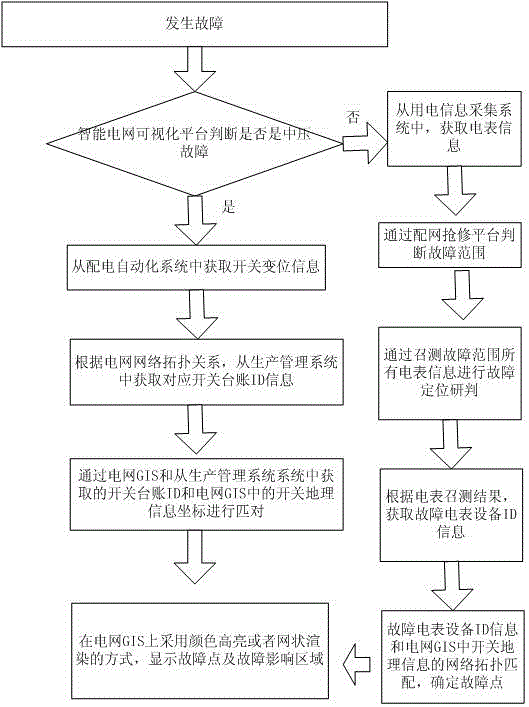
[0033] The present invention will be further described below in conjunction with the accompanying drawings.

[0034] Such as figure 1 As shown, the visual display method of the distribution network fault location based on the power grid GIS of the present invention includes the following steps,

[0035] Step (A), when a fault occurs in the power grid, the real-time data is transmitted to the smart grid visualization platform for fault judgment; the judgment process of the medium voltage fault is as follows,

[0036] (A1) According to the smart grid visualization platform information integration distribution automation, power consumption information collection system, 95598 repair telephone information data information, real-time operation mode of the power grid, analysis of power grid topology, and formation of fault diagnosis basis through information and data fusion;

[0037] (A2) Judging the scope of the power outage, the cause of the power outage, estimating the fault sec...


PUM


Abstract

The invention discloses a visual display method of power distribution network fault positioning based on a power grid GIS (geographic information system). The method includes the steps: acquiring data information of a power distribution automation system, a production management system, a distribution network production first-aid repair command platform, a power utility information acquisition system and the like by the aid of integrated functions of an intelligent power grid visualization platform; performing accurately positioning for switch fault points in the power grid GIS when faults happen through visualization based on the power grid GIS. Operators on duty rapidly respond and make decisions when encountering the faults, data of the power distribution automation system, the power utility information acquisition system and the distribution network production first-aid repair platform are deeply excavated and integrated, the power grid GIS serves as a carrier, the faults are accurately positioned through visualization technologies and device matching technologies, modernization requirements for power grids of electric power enterprises and wide users can be met, information management level of the electric power enterprises is improved, and the visual display method has a good application prospect.

Description

technical field [0001] The invention relates to the technical field of power grid fault analysis, in particular to a visual display method for fault location of distribution network based on power grid GIS. Background technique [0002] With the development and promotion of the smart grid, the power supply level of my country's power system is increasing day by day, which satisfies the power supply needs of various users better. higher requirements. An important aspect of improving the reliability of power supply is to reduce the occurrence of power outages. With the practical application of power distribution automation systems in various places, when a fault occurs, the fault area can be quickly isolated and the power supply can be quickly restored. However, with the lean level of the power grid With continuous improvement and continuous improvement of geographic information of power grid GIS equipment, how to accurately locate fault areas or fault points on power grid GIS...

Claims


Application Information

Patent Timeline
IPC IPC(8): G01R31/08
CPCG01R31/086Y04S10/52
Inventor 宋永强薛东吴琳陆彦虎梅华谭勇桂潘庆庆陈嘉辉刘军陈益果于海平
Owner NARI TECH CO LTD
Why Eureka
Try Eureka