Associated hierarchical data visualization method and application

A technology of hierarchical data and data, applied in the field of information visualization, can solve problems such as inability to view details

Active Publication Date: 2016-04-20
BEIJING TECHNOLOGY AND BUSINESS UNIVERSITY
View PDF4 Cites 14 Cited by
  • Summary
  • Abstract
  • Description
  • Claims
  • Application Information

AI Technical Summary

Problems solved by technology

The problem with the bound edges of the classic hierarchical data edge binding method (HEB method) is that you can only see the overall trend, but not the details

Method used


Image

  • Associated hierarchical data visualization method and application
  • Associated hierarchical data visualization method and application
  • Associated hierarchical data visualization method and application

Examples


Embodiment Construction

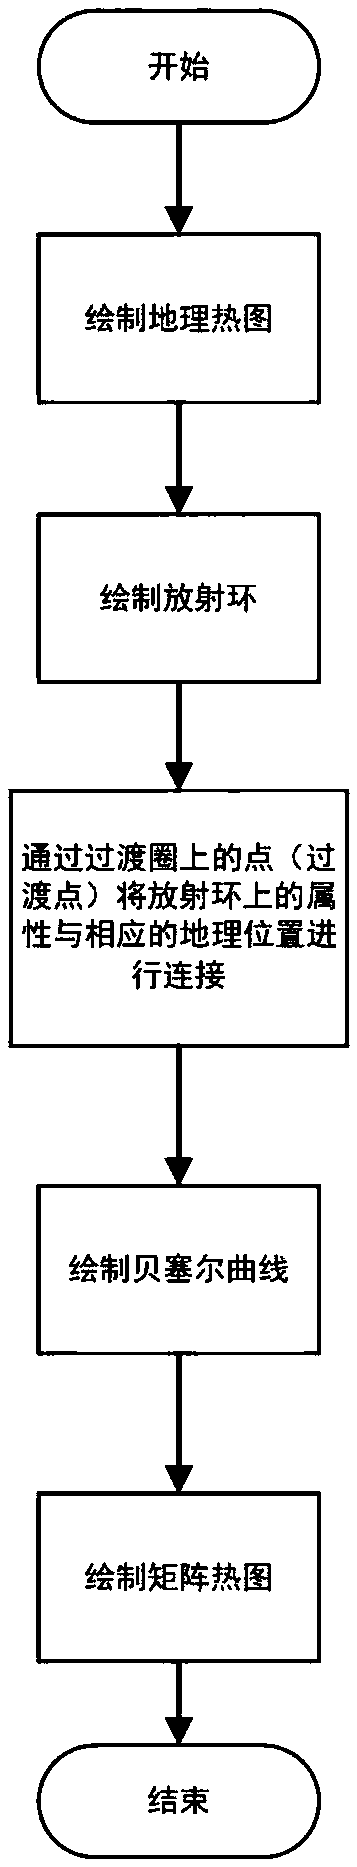
[0074] Below in conjunction with accompanying drawing, further describe the present invention through embodiment, but do not limit the scope of the present invention in any way.

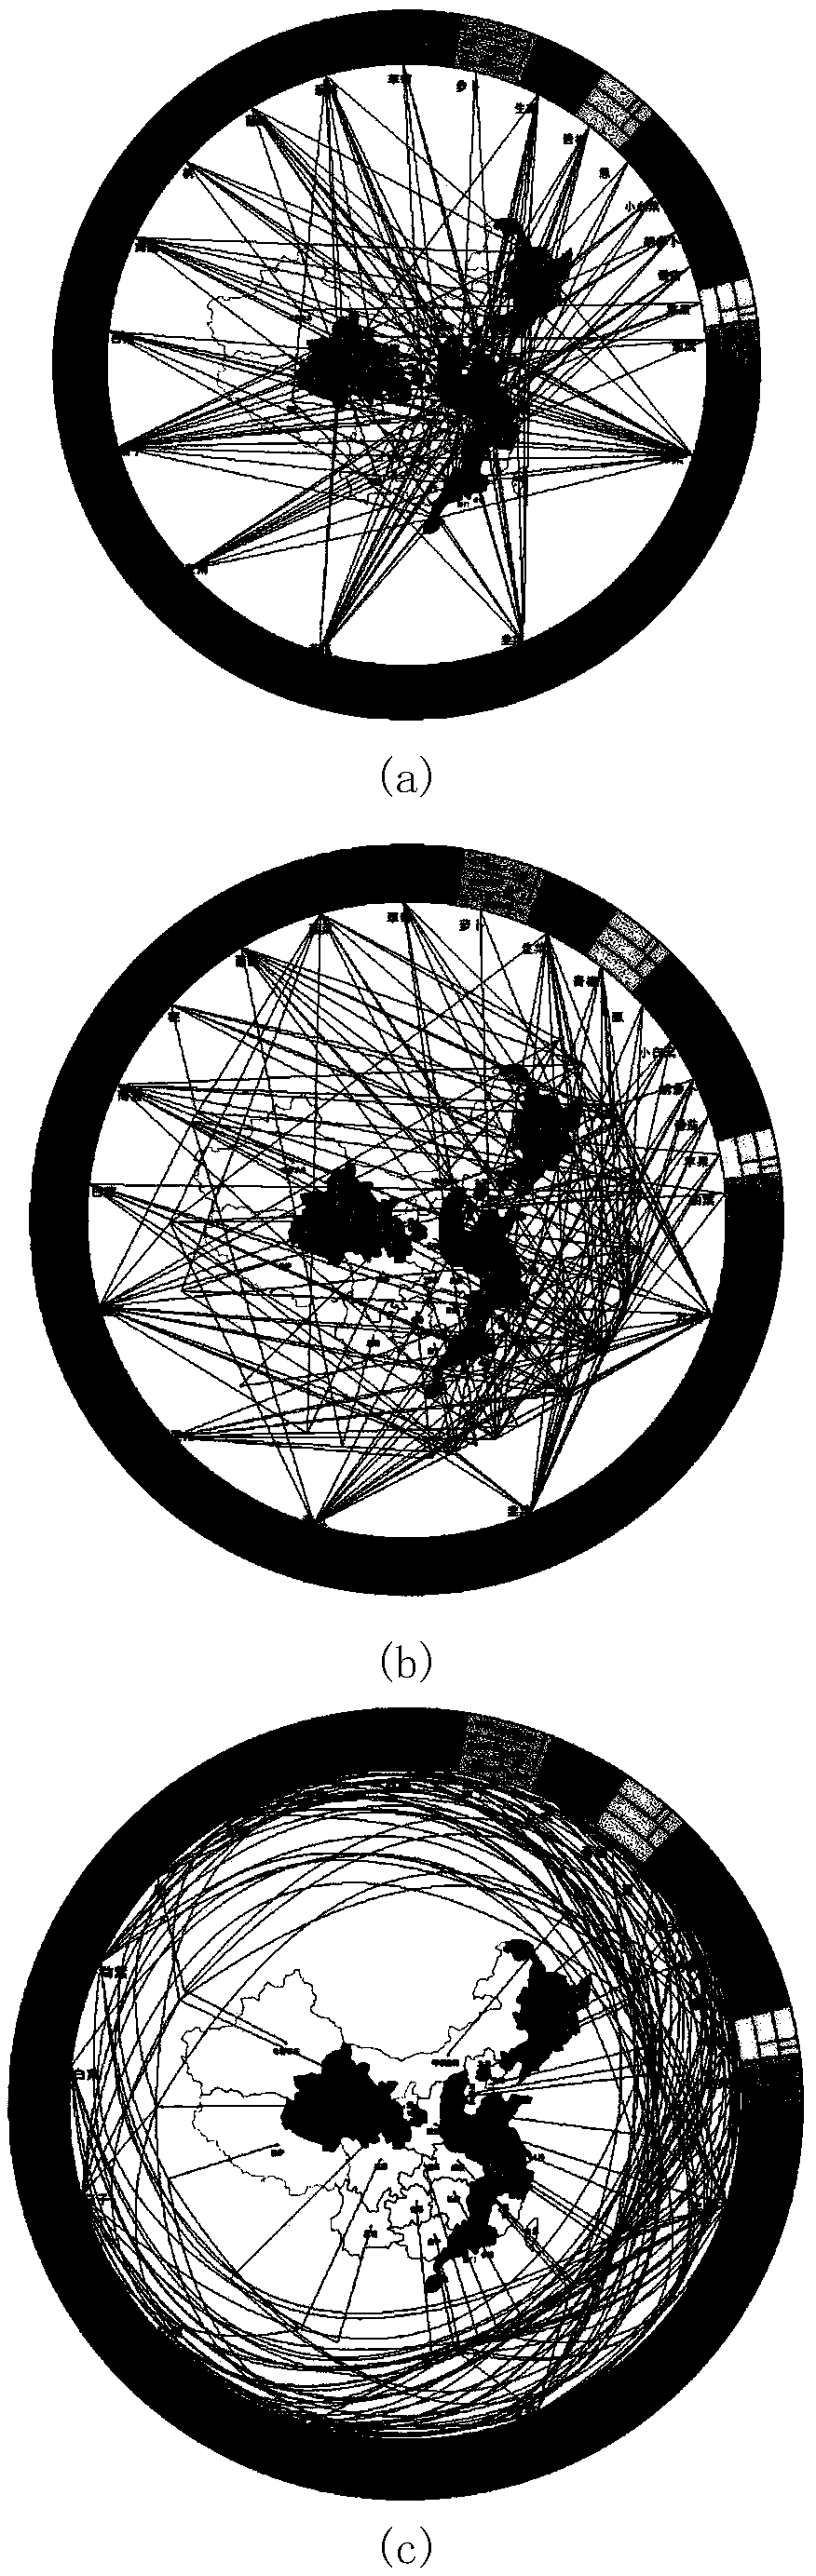
[0075] The present invention provides a method for visualizing associated hierarchical data based on heat maps and radiation rings (the invention is called the SunMap method), aiming at edge bonding methods, heat map implementations, and radiation based on node sorting in the visual analysis of associated hierarchical data. Ring algorithm for visualizing hierarchical data.

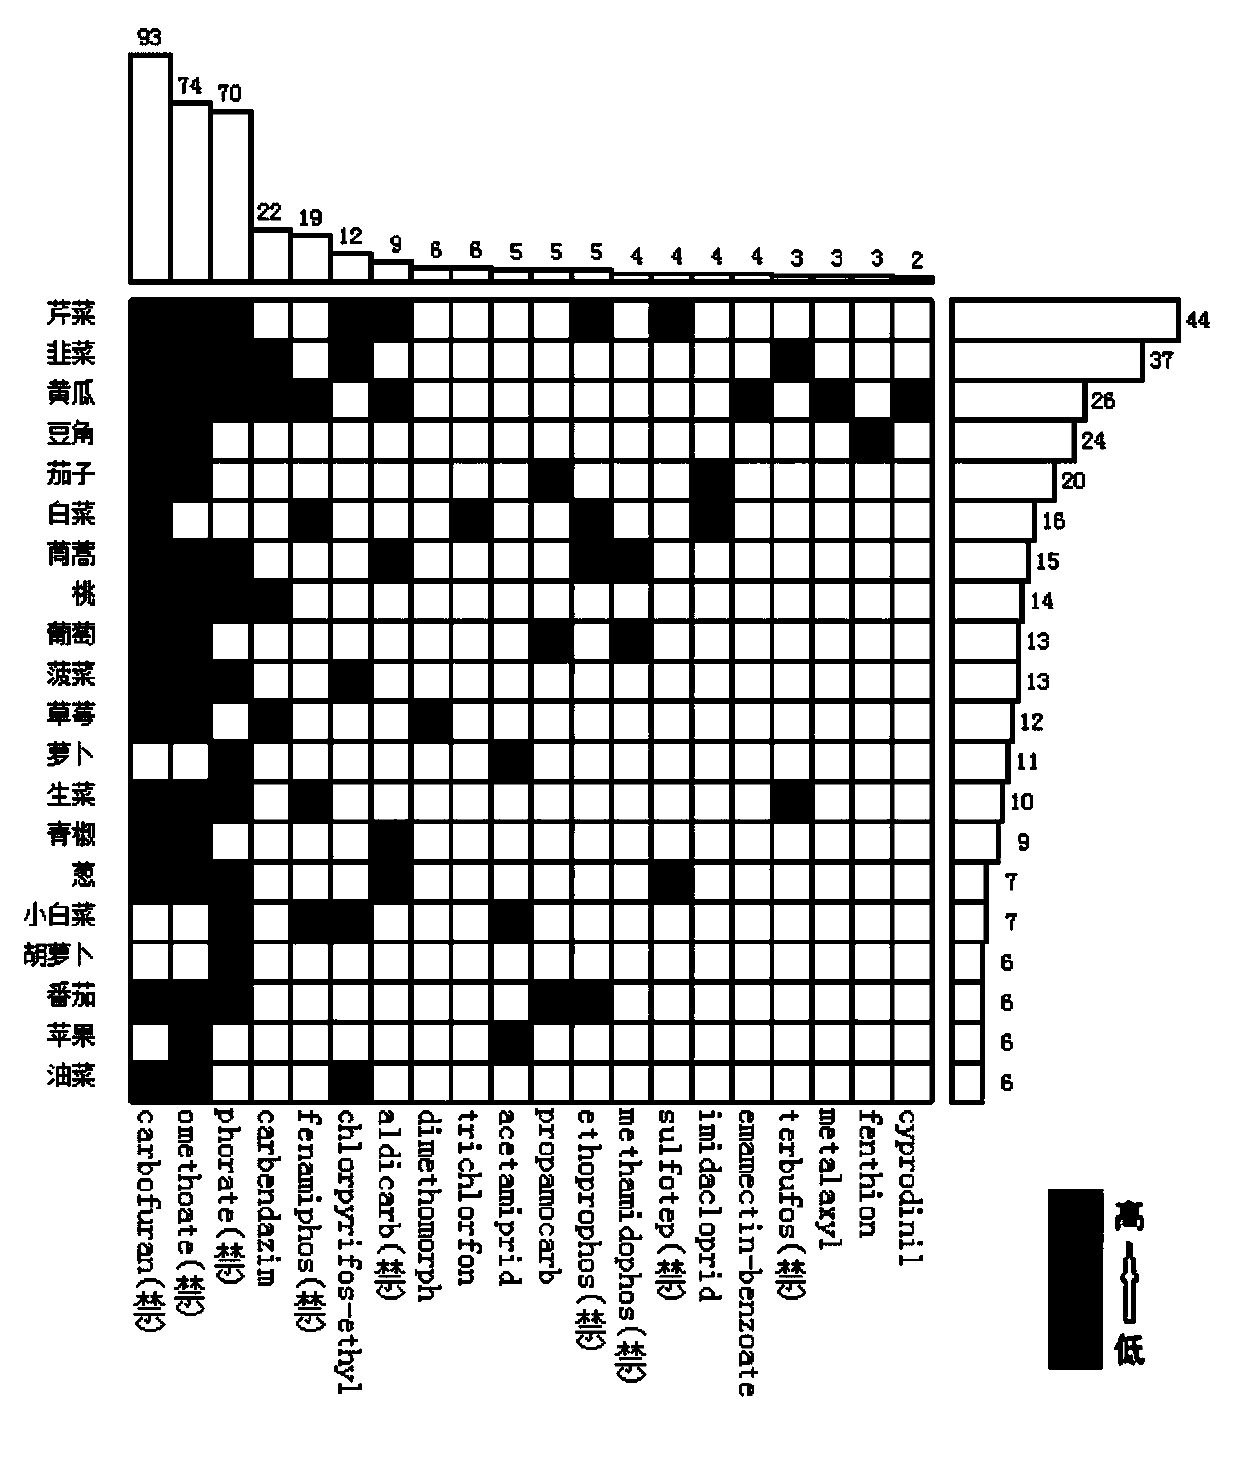
[0076] The data set to be visualized in this embodiment is a pesticide residue data set, and its attribute table is as shown in Table 3:

[0077] Table 3 Attribute representation of the pesticide residue dataset

[0078]

[0079]

[0080] Adopt the correlation hierarchical data visualization method SunMap (Sunburst+Map) based on the heat map and radial ring provided by the present invention, use the correlation hierarchica...


PUM


Abstract

The invention discloses an associated hierarchical data visualization method and application. Two kinds of associated hierarchical data sets with geographical distribution serve as data to be visualized, by arranging a map and introducing transition points in a radiation ring, data nodes in the two kinds of hierarchical data sets S1 and S2 are connected through a Bezier curve, visualization is carried out by drawing a rectangular heat map. The associated hierarchical data visualization method is applied to pesticide residue visualization analysis, an agricultural product kind and a pesticide kind which are associated with each other are set as two kinds of associated hierarchical data sets with geographical distribution, the geography heat map and the radiation ring are drawn to represent excessive pesticide agricultural products, the excessive pesticide type and pesticide toxicity distribution, and the Bezier curve and the matrix heat map are drawn. According to the invention, a multi-view and interaction method is employed to visualize associated hierarchical data, and data has smoothness, continuity and readability.

Description

technical field [0001] The invention belongs to the field of information visualization, and in particular relates to a method for visualizing correlated hierarchical data based on a heat map and a radiation ring and an application for visualizing pesticide residue data. Background technique [0002] The real world is a three-dimensional space, and data including geographical distribution can be seen everywhere. In the era of big data, the volume of data increases, the dimensions of data increase, and the types of data become more complex. Visual analysis of correlated hierarchical data has also become a hot topic and challenge. One of the very challenging types of big data is linked hierarchical data with geographic distribution. For example, data in food safety, transportation, transportation logistics, commercial trade, and electronic communication industries generally contain geographic location information, hierarchical relationships, and association relationships, and ...

Claims


Application Information

Patent Timeline
Patent Type & Authority Applications(China)
IPC IPC(8): G06F17/30
CPCG06F16/26
Inventor 陈谊赵云芳孙悦红林晓蕾张珣
Owner BEIJING TECHNOLOGY AND BUSINESS UNIVERSITY
Why Eureka
Try Eureka