Deforming statistical map based multi-view spatio-temporal data visualization method and application

A spatio-temporal data and multi-view technology, applied in the field of information visualization, can solve the problems that users cannot intuitively observe the data comparison situation, the user cannot intuitively display the data comparison situation, and it is not conducive to users to understand the data and interact, so as to improve the visualization effect, Enhanced visualization, avoiding the effect of occluding the map

Active Publication Date: 2017-01-25
BEIJING TECHNOLOGY AND BUSINESS UNIVERSITY
View PDF3 Cites 50 Cited by
  • Summary
  • Abstract
  • Description
  • Claims
  • Application Information

AI Technical Summary

Problems solved by technology

When displaying regional data, it is easy to cause the user's understanding deviation only through color rendering, which is not conducive to the user's understanding of the data and interaction; the user cannot flexibly compare and analyze the distribution of sampling points in different regions in different time periods
Adding a time axis is convenient for users to observe and filter sampling points in different periods, but for regional data visualization, users cannot intuitively observe the comparison of data in different regions in different periods; Visually display the comparison of data. It is time-consuming and labor-intensive for users to conduct comparative analysis, and the accuracy of user identification data is also low.

Method used


Image

  • Deforming statistical map based multi-view spatio-temporal data visualization method and application
  • Deforming statistical map based multi-view spatio-temporal data visualization method and application
  • Deforming statistical map based multi-view spatio-temporal data visualization method and application

Examples


Embodiment Construction

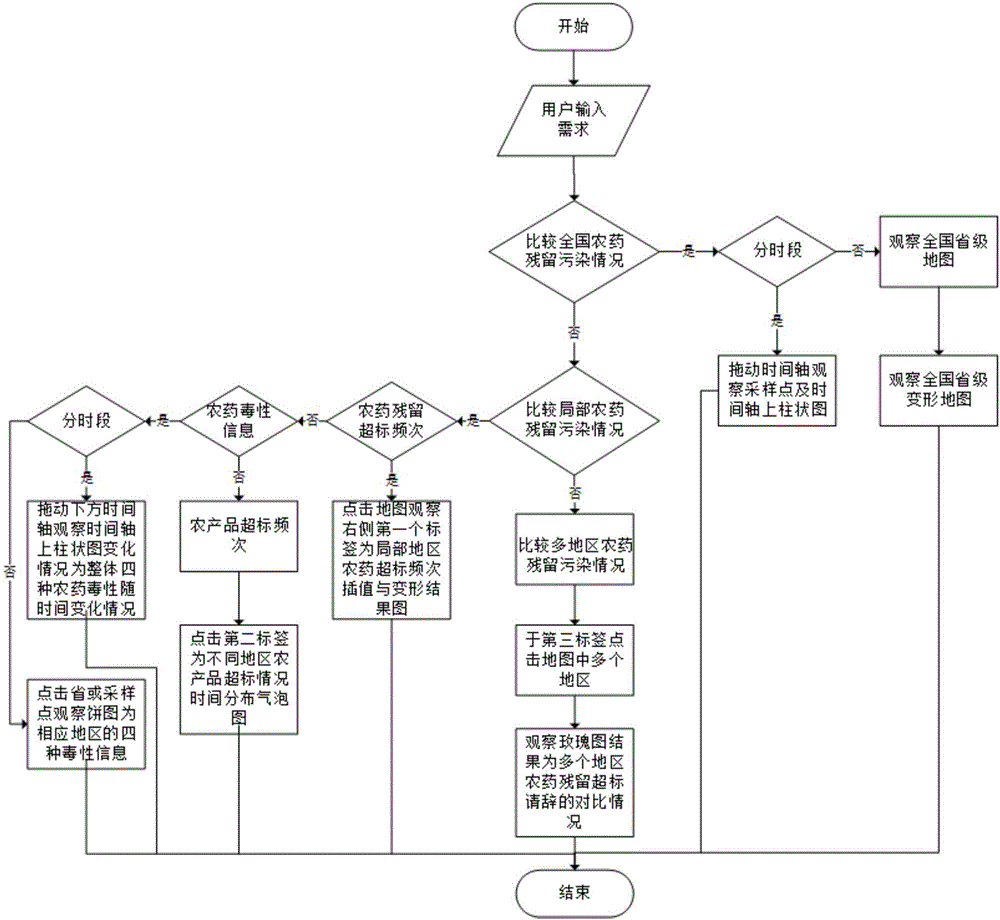
[0090] Below in conjunction with accompanying drawing, further describe the present invention through embodiment, but do not limit the scope of the present invention in any way.

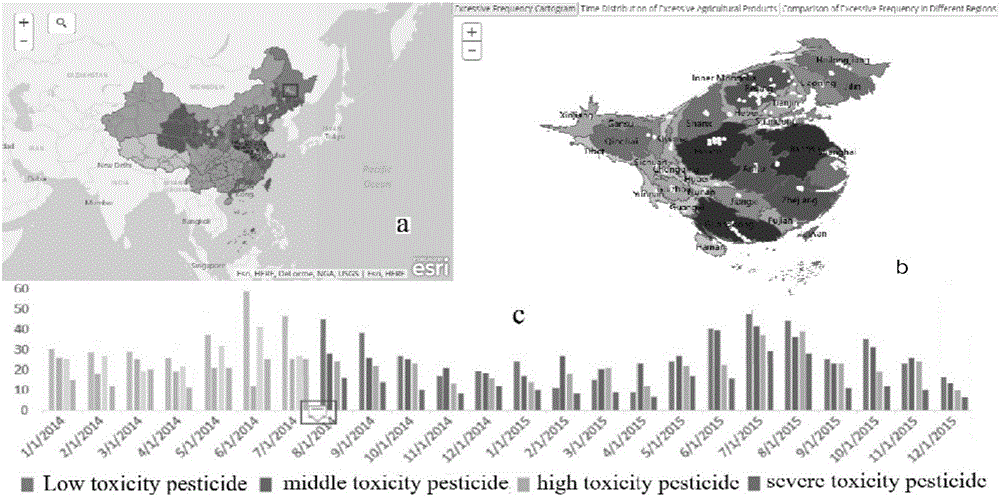
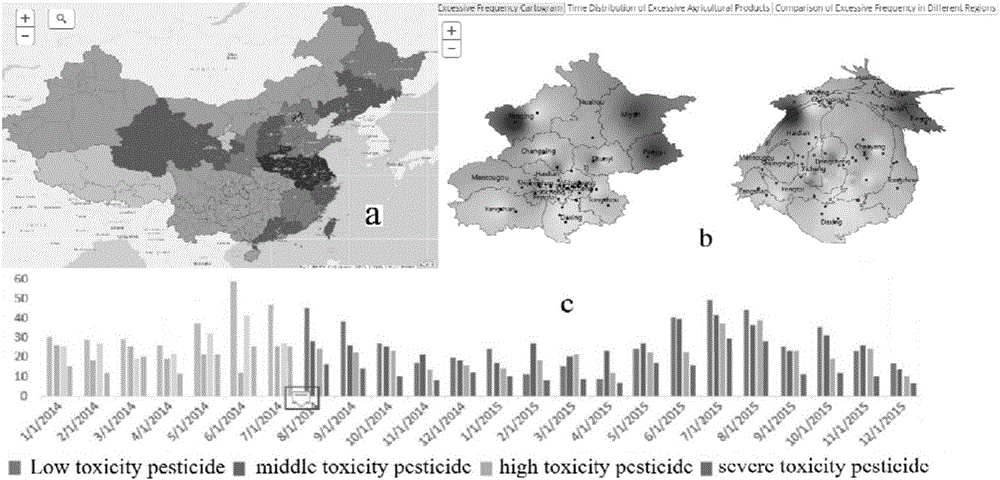
[0091] The present invention provides a spatio-temporal data visualization method based on a deformed map multi-view hybrid layout. For spatio-temporal data with geographic attributes and time attributes, traditional map methods, deformed map methods (statistical maps), time axes, and statistical charts are used. Pie charts, histograms, bubble charts and Nightingale rose charts are combined to form a multi-view multi-label hybrid layout method for spatio-temporal data visualization, avoiding the asymmetrical problems of data distribution and space utilization in traditional map visualization methods, and multi-dimensional data display Attributes display incomplete problem.

[0092] Pesticide residue data is statistical data. Existing methods synthesize almost all classic statistical charts such as pie...


PUM


Abstract

The invention discloses a deforming statistical map based multi-view spatio-temporal data visualization method and application. Spatio-temporal data having geography and time attributes is visualized by adopting a method of multi-view and multi-tag mixed layout formed by combining a traditional map, a statistical map, time axis and a pie chart, a bar graph, a bubble chart and a Nightingale rose diagram in a statistical chart, and the dissymmetry problem of data distribution and space utilization of a traditional map visualization method and the problem that the attributes of multi-dimensional data display are not comprehensively displayed are avoided. A user can be helped to understand all the aspects of data from multiple perspectives, meanwhile a classic visualized statistic analysis chart, the map time axis and the like are combined, so that data display is specific and vivid. The deforming statistical map based multi-view spatio-temporal data visualization method can be applied to the fields of data visualization of microblogs, WeChat, demographic statistics, infectious disease distribution, elector distribution and the like, and visualization and visual analysis conducted on the data having the time relation of spatial distribution are achieved.

Description

technical field [0001] The invention relates to the field of information visualization, in particular to a deformation map-based multi-view spatio-temporal data visualization method and application. Background technique [0002] So far, there have been many corresponding visualization techniques for different types of spatial data, which are mainly divided into point data visualization, line data visualization and area data visualization. Regional data visualization can be divided into two categories: Choropleth maps and Cartograms maps. The regional distribution map mainly realizes the mapping of data attributes and map spots through different colors. Statistical maps mainly realize the mapping of data attributes and map spots through area changes. The existing map visualization can directly display the data attributes that users are interested in on the map. It is also possible to combine map visualization with other visualization methods. The most common way is to dire...

Claims


Application Information

Patent Timeline
Patent Type & Authority Applications(China)
IPC IPC(8): G06F17/30G06F17/24
CPCG06F16/29G06F40/174
Inventor 陈谊赵云芳张珣孙悦红
Owner BEIJING TECHNOLOGY AND BUSINESS UNIVERSITY
Why Eureka
Try Eureka