
Image encryption algorithm based on blocking DNA encoding and even scrambling
An encryption algorithm and coding technology, applied in image coding, image data processing, image data processing, etc., can solve the problem of low security
- Summary
- Abstract
- Description
- Claims
- Application Information
AI Technical Summary
Problems solved by technology
Method used
Image

Examples
Embodiment Construction
[0031] 1. The initial value of the Logistic chaotic map x=0.683, y=0.172, μ 1 = 3.8 and μ 2 =3.9, the initial value of a=0.533, b=0.221 and c=0.898 of the Lorenz chaotic map, the initial value of the number of blocks B is 16, the initial value of the number of iterations clp1=10, clp2=10.
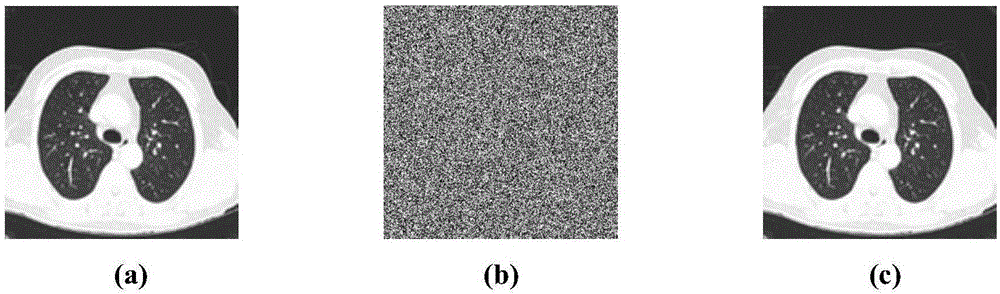
[0032] 2, figure 1 (a)- figure 1 (c) is an encryption and decryption effect diagram obtained by performing a simulation experiment on a 256×256 lung CT grayscale image. figure 1 (a) is the original grayscale lung CT image, figure 1 (b) is an encrypted image, figure 1 (c) is the decrypted image.
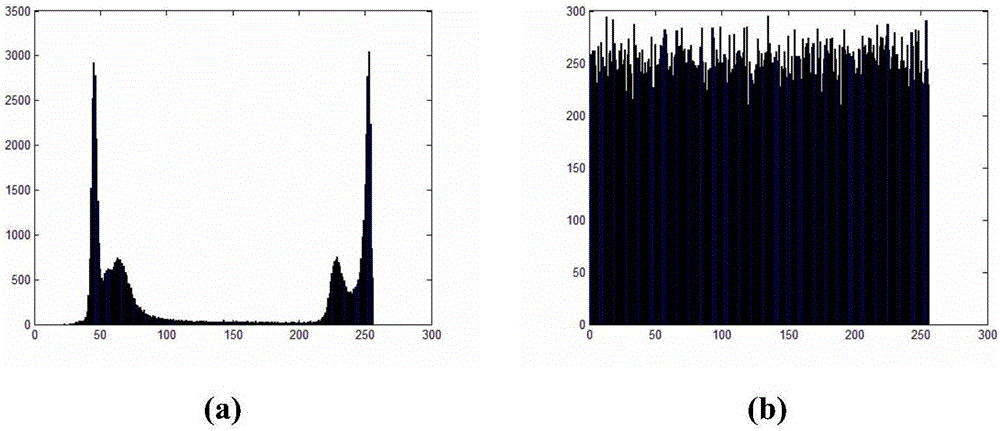
[0033] 3. figure 2 (a)- figure 2 (b) is the effect diagram of the gray histogram analysis of the lung CT image before and after encryption. Through comparison, it can be found that the pixel values of the gray histogram before encryption are concentrated on some values, but the pixel distribution of the gray histogram of the image after encryption is relatively uniform, which shows that...
PUM
 Abstract
Description
Claims
Application Information