Time Lapse Analysis with Electromagnetic Data

Active Publication Date: 2009-01-01
EXXONMOBIL UPSTREAM RES CO
View PDF14 Cites 38 Cited by
  • Summary
  • Abstract
  • Description
  • Claims
  • Application Information

AI Technical Summary

Problems solved by technology

A critical issue for economical production of hydrocarbons (gas, gas condensate, and oil) from reservoirs is accurate knowledge of the distribution of hydrocarbon saturation within the porous rocks that comprise the reservoir.
As hydrocarbons are produced from the reservoir, the hydrocarbon saturation decreases and the water saturation increases in a non-uniform manner within the reservoir.
Although seismic methods have been developed for 4D applications to monitor reservoir fluids, such methods are expensive, and are often ineffective due to the relatively low sensitivity of the seismic response to changes in hydrocarbon saturation.
However, well logging methods are not effective between wells that are usually spaced hundreds to thousands of meters apart as found in many hydrocarbon fields, due to the limited penetration distance of the probing signals into the reservoir from the downhole well logging apparatus.
In addition, production wells are usually enclosed with electrically conductive casing, which severely limits the use of electrical methods to monitor reservoir fluid resistivity since the reservoir is shielded from the electrical probing signal by the casing (except at very low frequency).
However, crosswell methods require at least two wells to be used simultaneously for the measu

Method used


Image

  • Time Lapse Analysis with Electromagnetic Data
  • Time Lapse Analysis with Electromagnetic Data
  • Time Lapse Analysis with Electromagnetic Data

Examples


examples

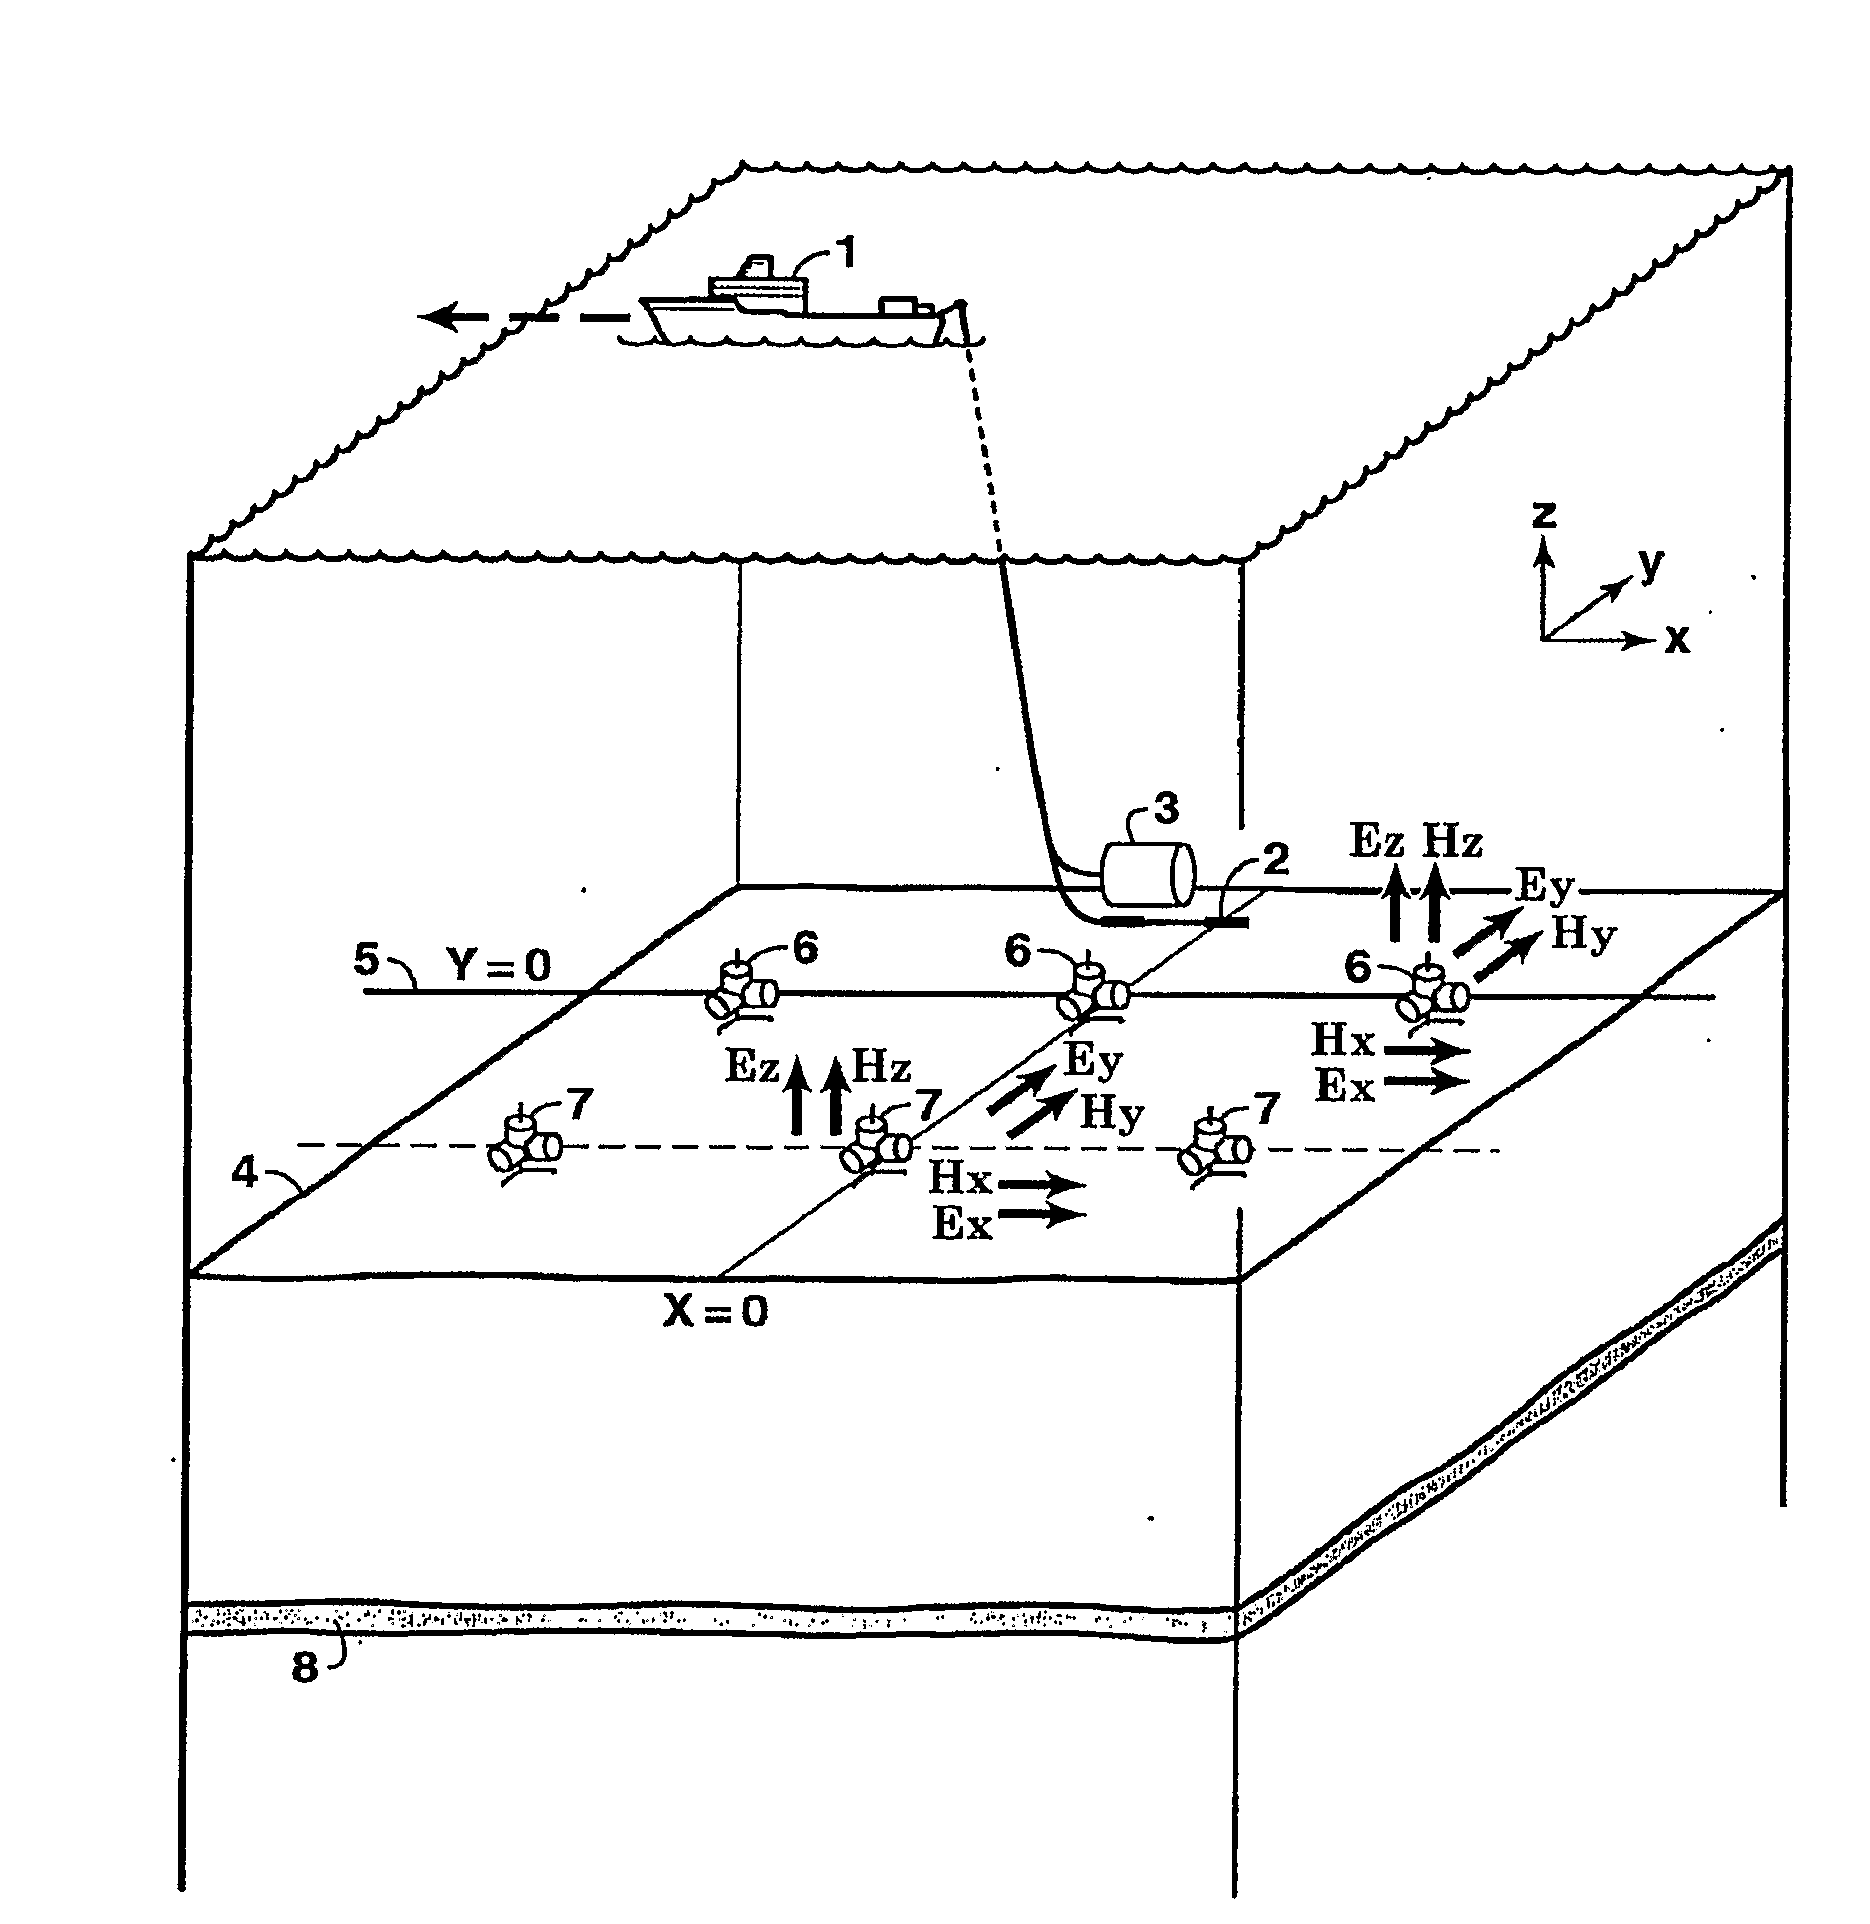
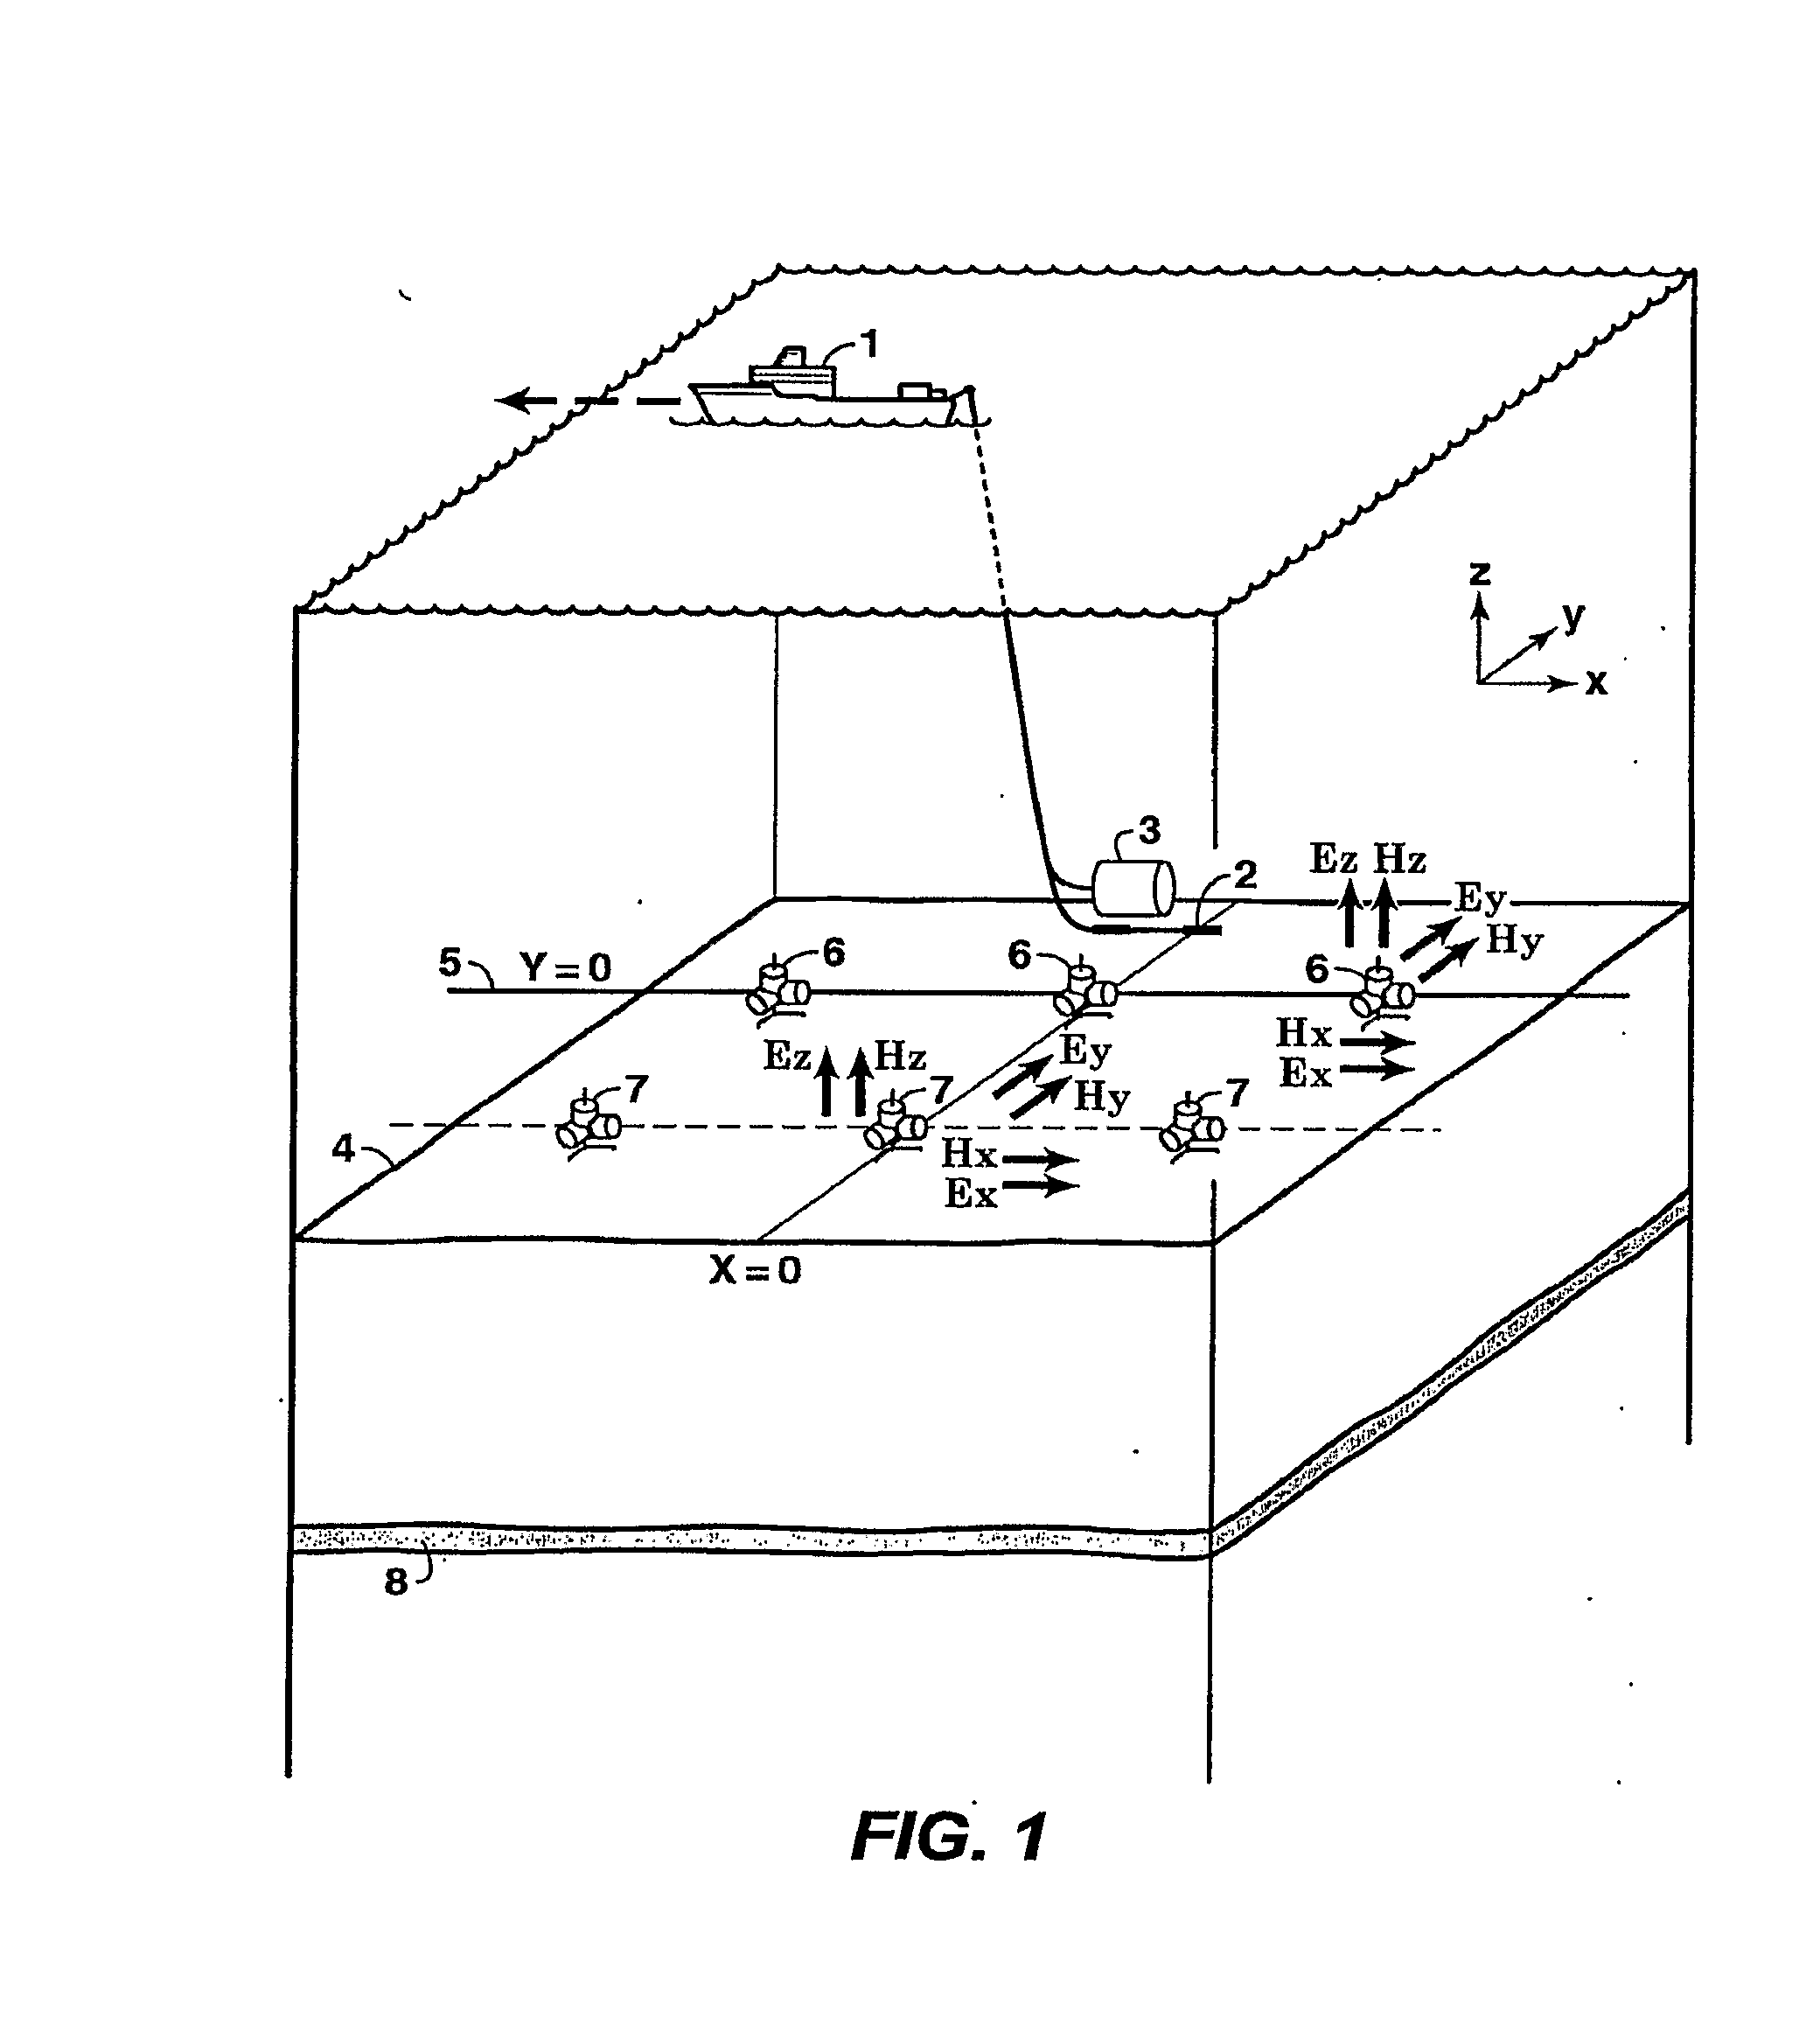
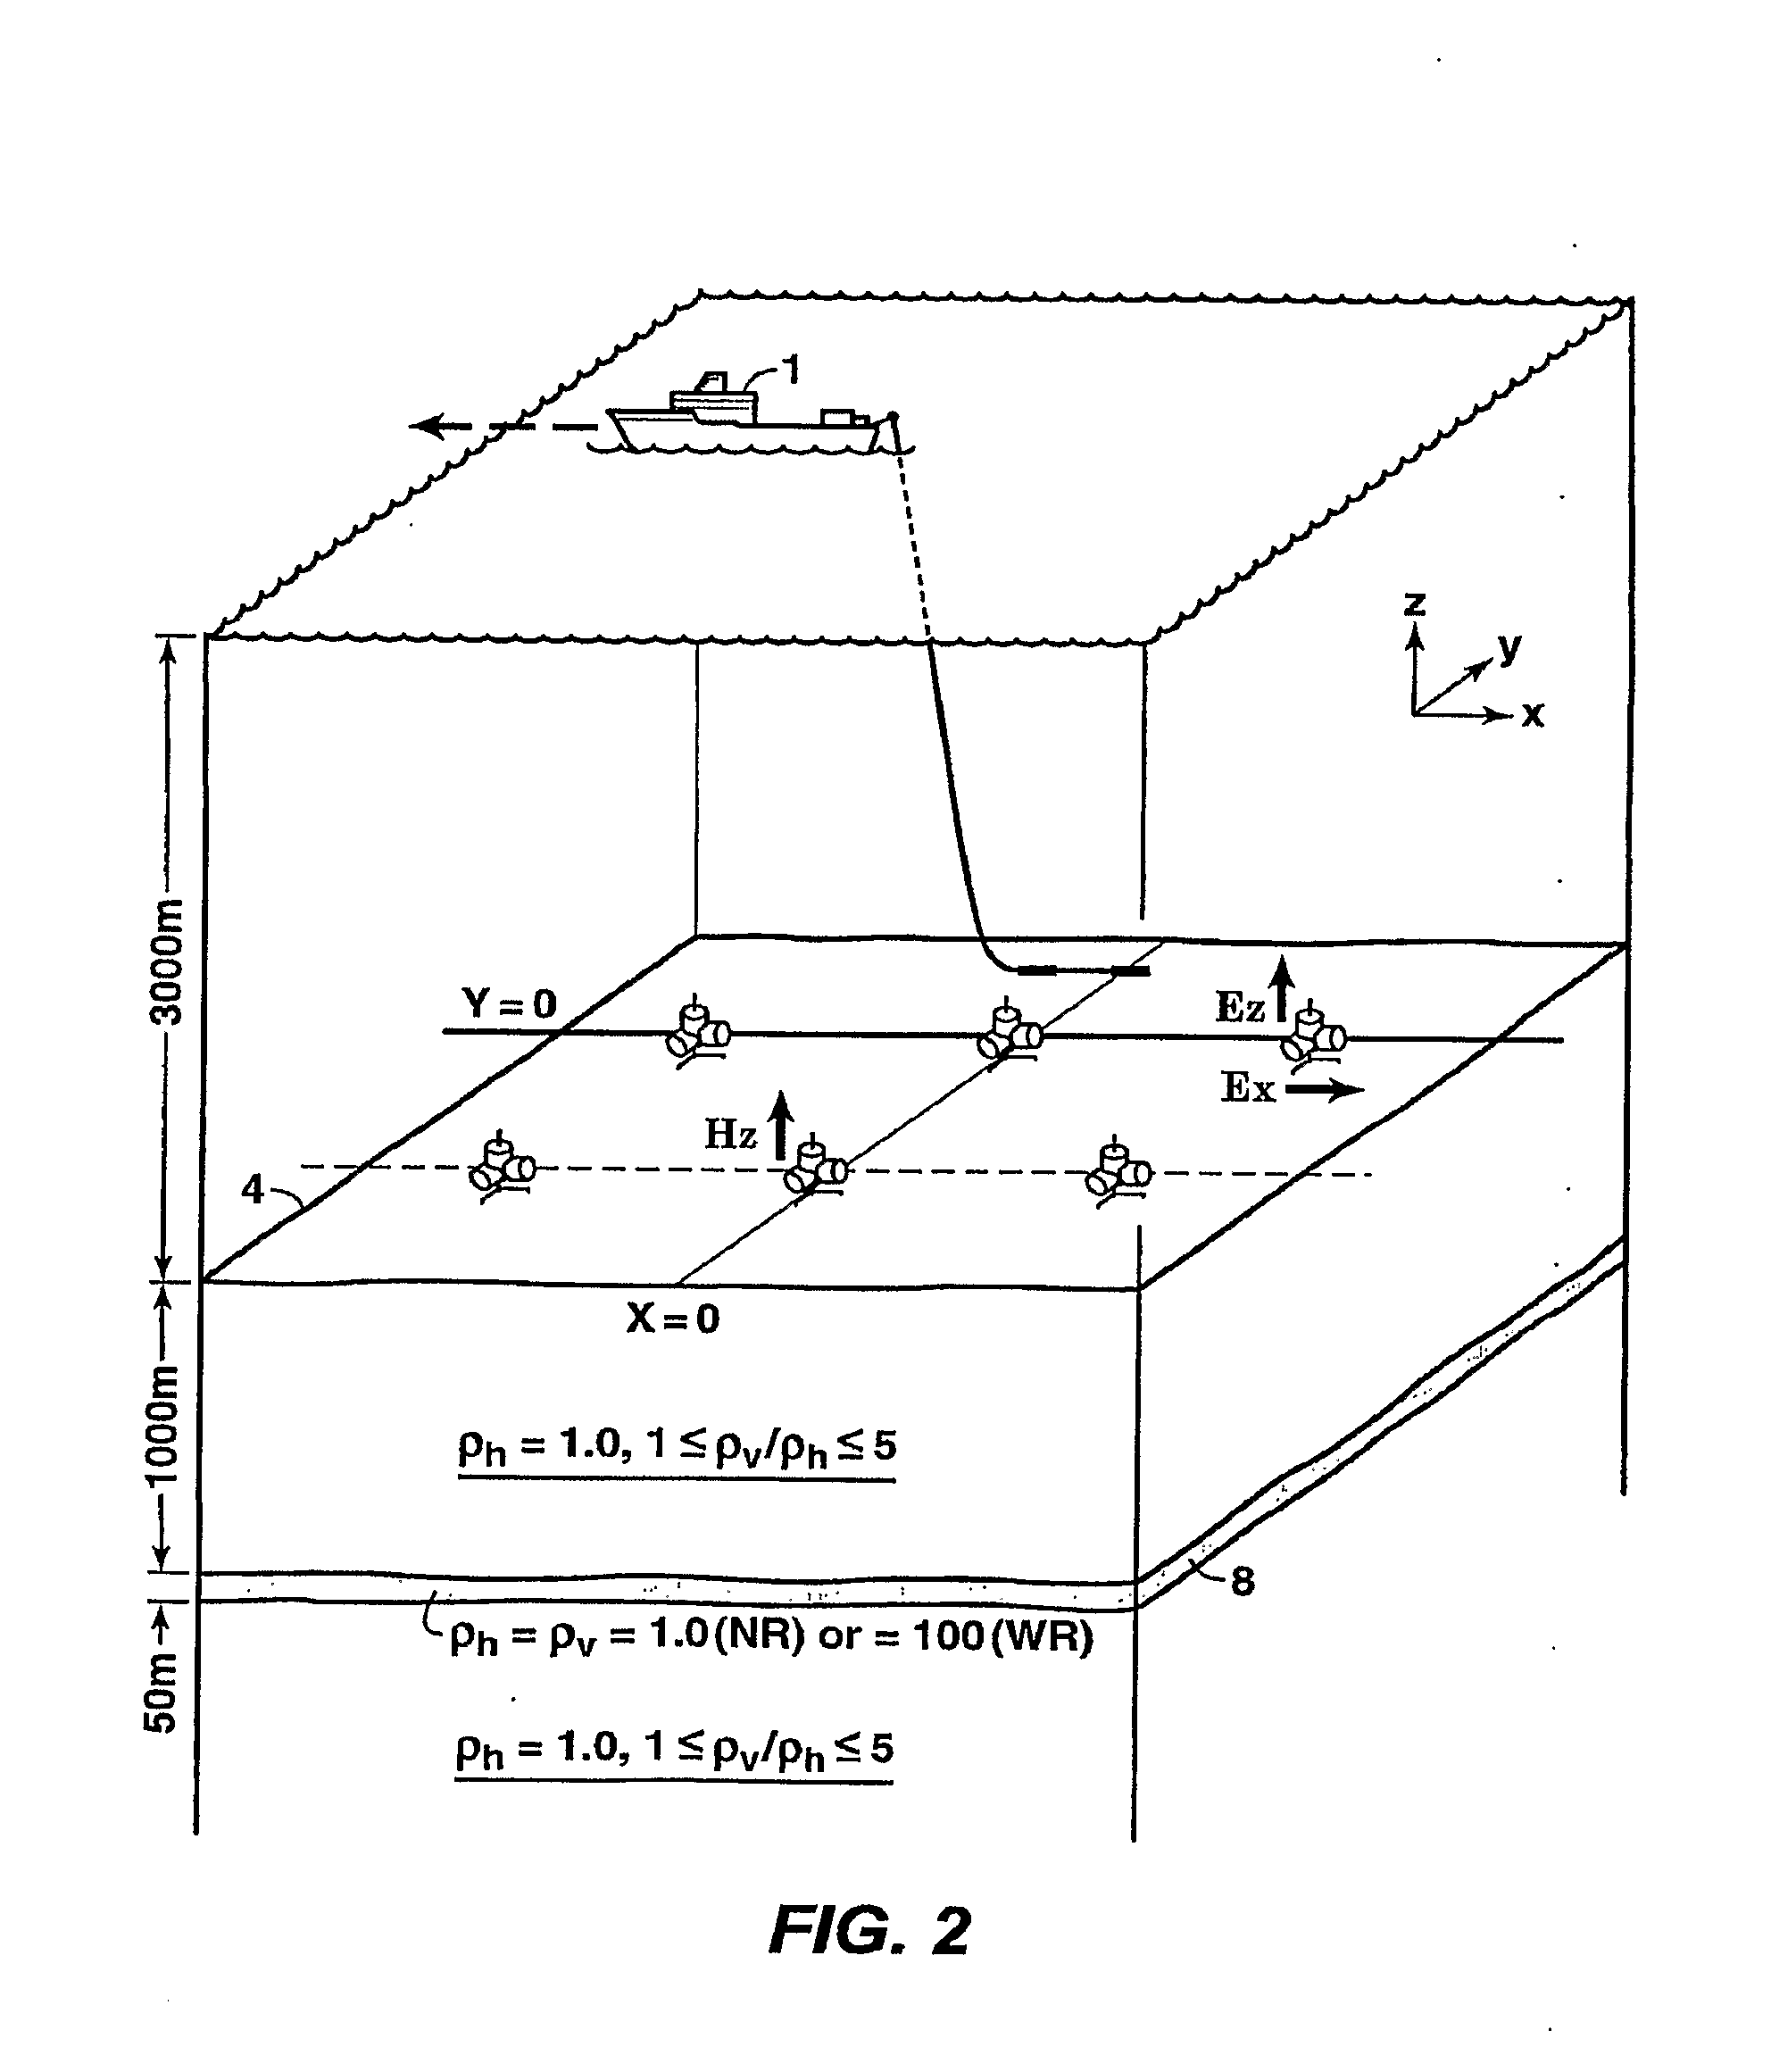
[0055]In lieu of actual CSEM data of the type and combination required in this invention, numerical calculations that employ 1D methods well known to practitioners of the art are used herein to demonstrate the seafloor electromagnetic responses utilized by the invention. FIG. 2 shows the survey geometry and 1D resistivity model used for this model calculation of CSEM response data. The equipment layout is the same as in FIG. 1 (and the same reference numbers apply), except only an HED source is used. The model for this example uses a seawater depth of 3000 meters and a 50 meter thick simulated hydrocarbon reservoir 8 whose top is buried 1000 meters below the seafloor. FIGS. 3A and 3B show the calculated changes in the HED source-normalized (i.e., responses for a unit dipole of length one meter and current of one Ampere) online Ex seafloor field amplitudes in volts / meter (FIG. 3A) and the absolute phases (FIG. 3B) caused by EVTI of varying magnitudes (1:1 to 5:1 EVTI ratio ρv:ρh, whe...


PUM


Abstract

Method for determining time-dependent changes [73] in the earth vertical and horizontal electrical resistivity and fluid saturations from offshore electromagnetic survey measurements. The method requires both online and offline data, which should include at least one electromagnetic field component sensitive at least predominantly to vertical resistivity and another component sensitive at least predominately to horizontal resistivity [62]. Using a horizontal electric dipole source, online Ez and offline Hz measurements are preferred. For a horizontal magnetic dipole source, online H2 and offline E2 data are preferred. Magnetotelluric data may be substituted for controlled source data sensitive at least predominantly to horizontal resistivity. Maxwell's equations are solved by forward modeling [64,65] or by inversion [66,67], using resistivity models of the subsurface that are either isotropic contrast, and [64,66] or anisotropic [65,67]. Fluid saturation is determined from the vertical and horizontal resistivities using empirical relations or rock physics models [70].

Description

[0001]This application claims the benefit of U.S. Provisional Application No. 60 / 797,560 filed on May 4, 2006.FIELD OF THE INVENTION[0002]This invention relates generally to the field of geophysical prospecting, and more particularly to controlled-source electromagnetic surveys typically in offshore environments, in which a controlled electromagnetic transmitter is towed above or positioned between electromagnetic receivers on the sea floor, for the purposes of hydrocarbon exploration, development, and production. Specifically, the invention is a method for determining the difference between the electrical resistivity of a subsurface reservoir at an initial time and its electrical resistivity at one or more later times, and relating that difference to production of hydrocarbons from the reservoir during the interim period.BACKGROUND OF THE INVENTION[0003]This invention addresses the problem of determining the three-dimensional (3D) distribution of hydrocarbon fluids within a subsurf...

Claims


Application Information

Patent Timeline
IPC IPC(8): G01V3/30
CPCG01V3/12G01V3/083
Inventor SRNKA, LEONARD J.CARAZZONE, JAMES J.PAVLOV, DMITRIY A.
Owner EXXONMOBIL UPSTREAM RES CO
Why Eureka
Try Eureka