Collaborative visualization method for long-term trend and local fluctuation of durability index

A durability and index technology, applied in the field of data visualization processing, can solve the problems of inability to understand the overall change trend and local fluctuations of durability performance, inability to find out test anomalies in time, lack of data analysis methods and tools, etc. The effect of disordered, easy to understand and accurate test results

Pending Publication Date: 2021-05-25
CENT SOUTH UNIV
View PDF0 Cites 0 Cited by
  • Summary
  • Abstract
  • Description
  • Claims
  • Application Information

AI Technical Summary

Problems solved by technology

[0003] Based on the durability test of automobile starter, a visual analysis method is proposed to understand the long-term trend and local fluctuation of large-scale long-term durability test data; durability test refers to the long-term or replicated service conditions of components and subsystems , to verify the product design, and determine the service life process in the early stage of product development, the durability test usually generates a large amount of test data, which contains rich information related to the working load of the test piece, durability performance, Internet of Things, CPS, etc. The wide application of these data makes it easy to obtain, transmit and share these data from smart factories, however, due to the lack of effective data analysis methods and tools, these data are often overlooked
[0004] When the testers and engineers analyze and understand the durability test data, they cannot compare the test data of multiple sets of test indicators, nor can they understand the overall change trend and local fluctuations of the durability performance, and cannot find out the abnormal conditions in the test in time. Therefore, it is urgent to provide a visual interface to help testers complete analysis tasks, so as to fully understand the durability test data

Method used


Image

  • Collaborative visualization method for long-term trend and local fluctuation of durability index
  • Collaborative visualization method for long-term trend and local fluctuation of durability index
  • Collaborative visualization method for long-term trend and local fluctuation of durability index

Examples


Embodiment

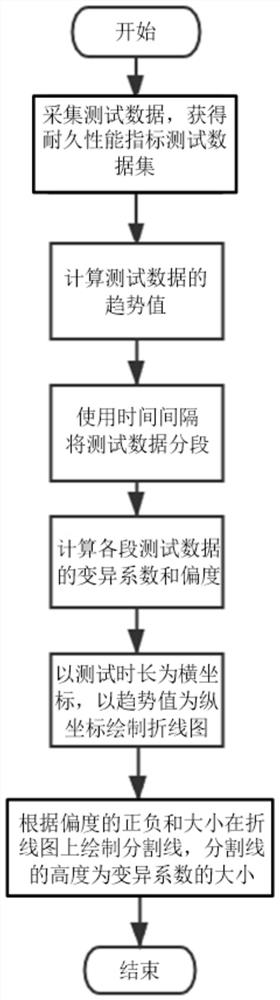
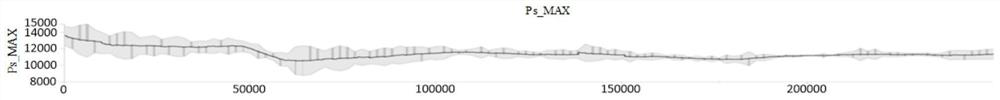
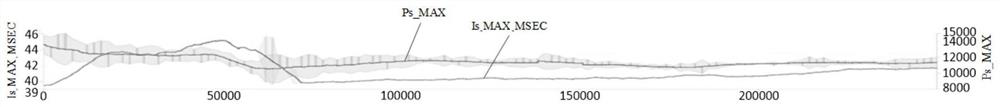
[0042] The process of visually displaying 250,000 times of durability test data using the present invention is as follows:

[0043] Step 1, the durability test data includes the test data of two durability performance indicators Ps_MAX and Is_MAX_MSEC, and the test data is preprocessed to generate the durability test data set T={T 1 , T 2}, where T 1 ={a 11 ,a 12 ,...,a 1t ,…,a 1 250000},T 2 ={a 21 ,a 22 ,...,a 2t ,…,a 2 250000}, a 1t is the test value of the first durability performance index at time t, a 2t is the test value of the second durability performance index at time t;

[0044] Step 2, calculate the set T 1 , set T 2 The trend value tr of each element in 1t 、tr 2t , tr 1t for a 1t trend value, tr 2t for a 2t The trend value of the trend data set T is obtained 1 '={tr 11 ,tr 12 ,...,tr 1t ,…,tr 1 250000}, T 2 '={tr 21 ,tr 22 ,...,tr 2t ,…,tr 2 250000}, the

[0045] Step 3, the test data set T with a time interval length of 2000 1 ,...


PUM


Abstract

The invention discloses a collaborative visualization method for long-term trend and local fluctuation of a durability index, and the method specifically comprises the following steps: 1, collecting test data of the durability index, and sorting the test data according to a time sequence to obtain a test data set; 2, calculating a trend value of the test data at each moment; 3, segmenting the test data according to time intervals, and calculating a variable coefficient and skewness of each segment of test data; 4, drawing a curve by taking the duration of the test process as an abscissa and the trend value of the test data as an ordinate, drawing a segmentation line on the curve according to the skewness and positive and negative values, and visually displaying the durability index test data; according to the invention, the test process of each durability index can be visually displayed, and the variation trend of the durability in the test process and the fluctuation condition of the performance in each test period can be conveniently known, so that the durability can be specifically analyzed, and a more accurate test result can be obtained.

Description

technical field [0001] The invention belongs to the technical field of data visualization processing, and in particular relates to a collaborative visualization method of long-term trends and local fluctuations of durability performance indicators. Background technique [0002] In recent years, Industry 4.0 has become a major topic in the world. With the wide application of emerging technologies such as the Internet of Things and CPS, industrial process data from various sources has grown exponentially. People are facing unprecedented challenges in processing data analysis. Visualization technology as An important technology for interpreting and understanding complex data, it is increasingly being introduced into industrial data analysis scenarios to improve work efficiency and promote process innovation. [0003] Based on the durability test of automobile starter, a visual analysis method is proposed to understand the long-term trend and local fluctuation of large-scale lon...

Claims


Application Information

Patent Timeline
Patent Type & Authority Applications(China)
IPC IPC(8): G06Q10/06G06F16/26
CPCG06Q10/06393G06F16/26
Inventor 樊晓平李世杰白庚淮何振胡可赵颖周芳芳
Owner CENT SOUTH UNIV
Why Eureka
Try Eureka