System and method for processig map data

a map data and processig technology, applied in static indicating devices, memory adressing/allocation/relocation, instruments, etc., can solve the problems of increased use, lack of high resolution images, slow response of traditional gis applications and web-based mapping tools, etc., to facilitate access to the selected number of image tiles, increase processing and memory resources, and high resolution

Active Publication Date: 2006-08-03
UNCHARTED SOFTWARE INC
View PDF5 Cites 175 Cited by
  • Summary
  • Abstract
  • Description
  • Claims
  • Application Information

AI Technical Summary

Benefits of technology

[0009] When viewing satellite imagery, categorizing land use data, or comparing the changes of land cover before / after the disasters, traditional GIS applications and Web-based mapping tools can suffer from the slow response and the lack of high resolution images because of the limitation of image data sizes and the network communications. Further, loading of multiple image segments or tiles by a requesting application can result in an increased use of processing and memory resources that can undesirably reduce the display response of requested map data. Contrary to current systems is provided a system and method for assembling graphics information as a graphics display for presentation on a visual interface, the graphics information including a plurality of image tiles stored in a data store. The system and method comprise a management module for receiving a graphics request message and for coordinating processing of a selected number of the image tiles to generate at least one representative image tile as the graphics display in response to the graphics request message. The system and method also comprise a graphics system coupled to the management module for receiving processing information from the management module to facilitate access to the selected number of the image tiles. The selected number of image tiles are processed as a combination to generate the least one representative image tile, such that the graphics system includes graphics hardware such as a GPU / VPU configured for processing the graphics information.

Problems solved by technology

When viewing satellite imagery, categorizing land use data, or comparing the changes of land cover before / after the disasters, traditional GIS applications and Web-based mapping tools can suffer from the slow response and the lack of high resolution images because of the limitation of image data sizes and the network communications.
Further, loading of multiple image segments or tiles by a requesting application can result in an increased use of processing and memory resources that can undesirably reduce the display response of requested map data.

Method used


Image

  • System and method for processig map data
  • System and method for processig map data
  • System and method for processig map data

Examples


Embodiment Construction

System 8 Overview

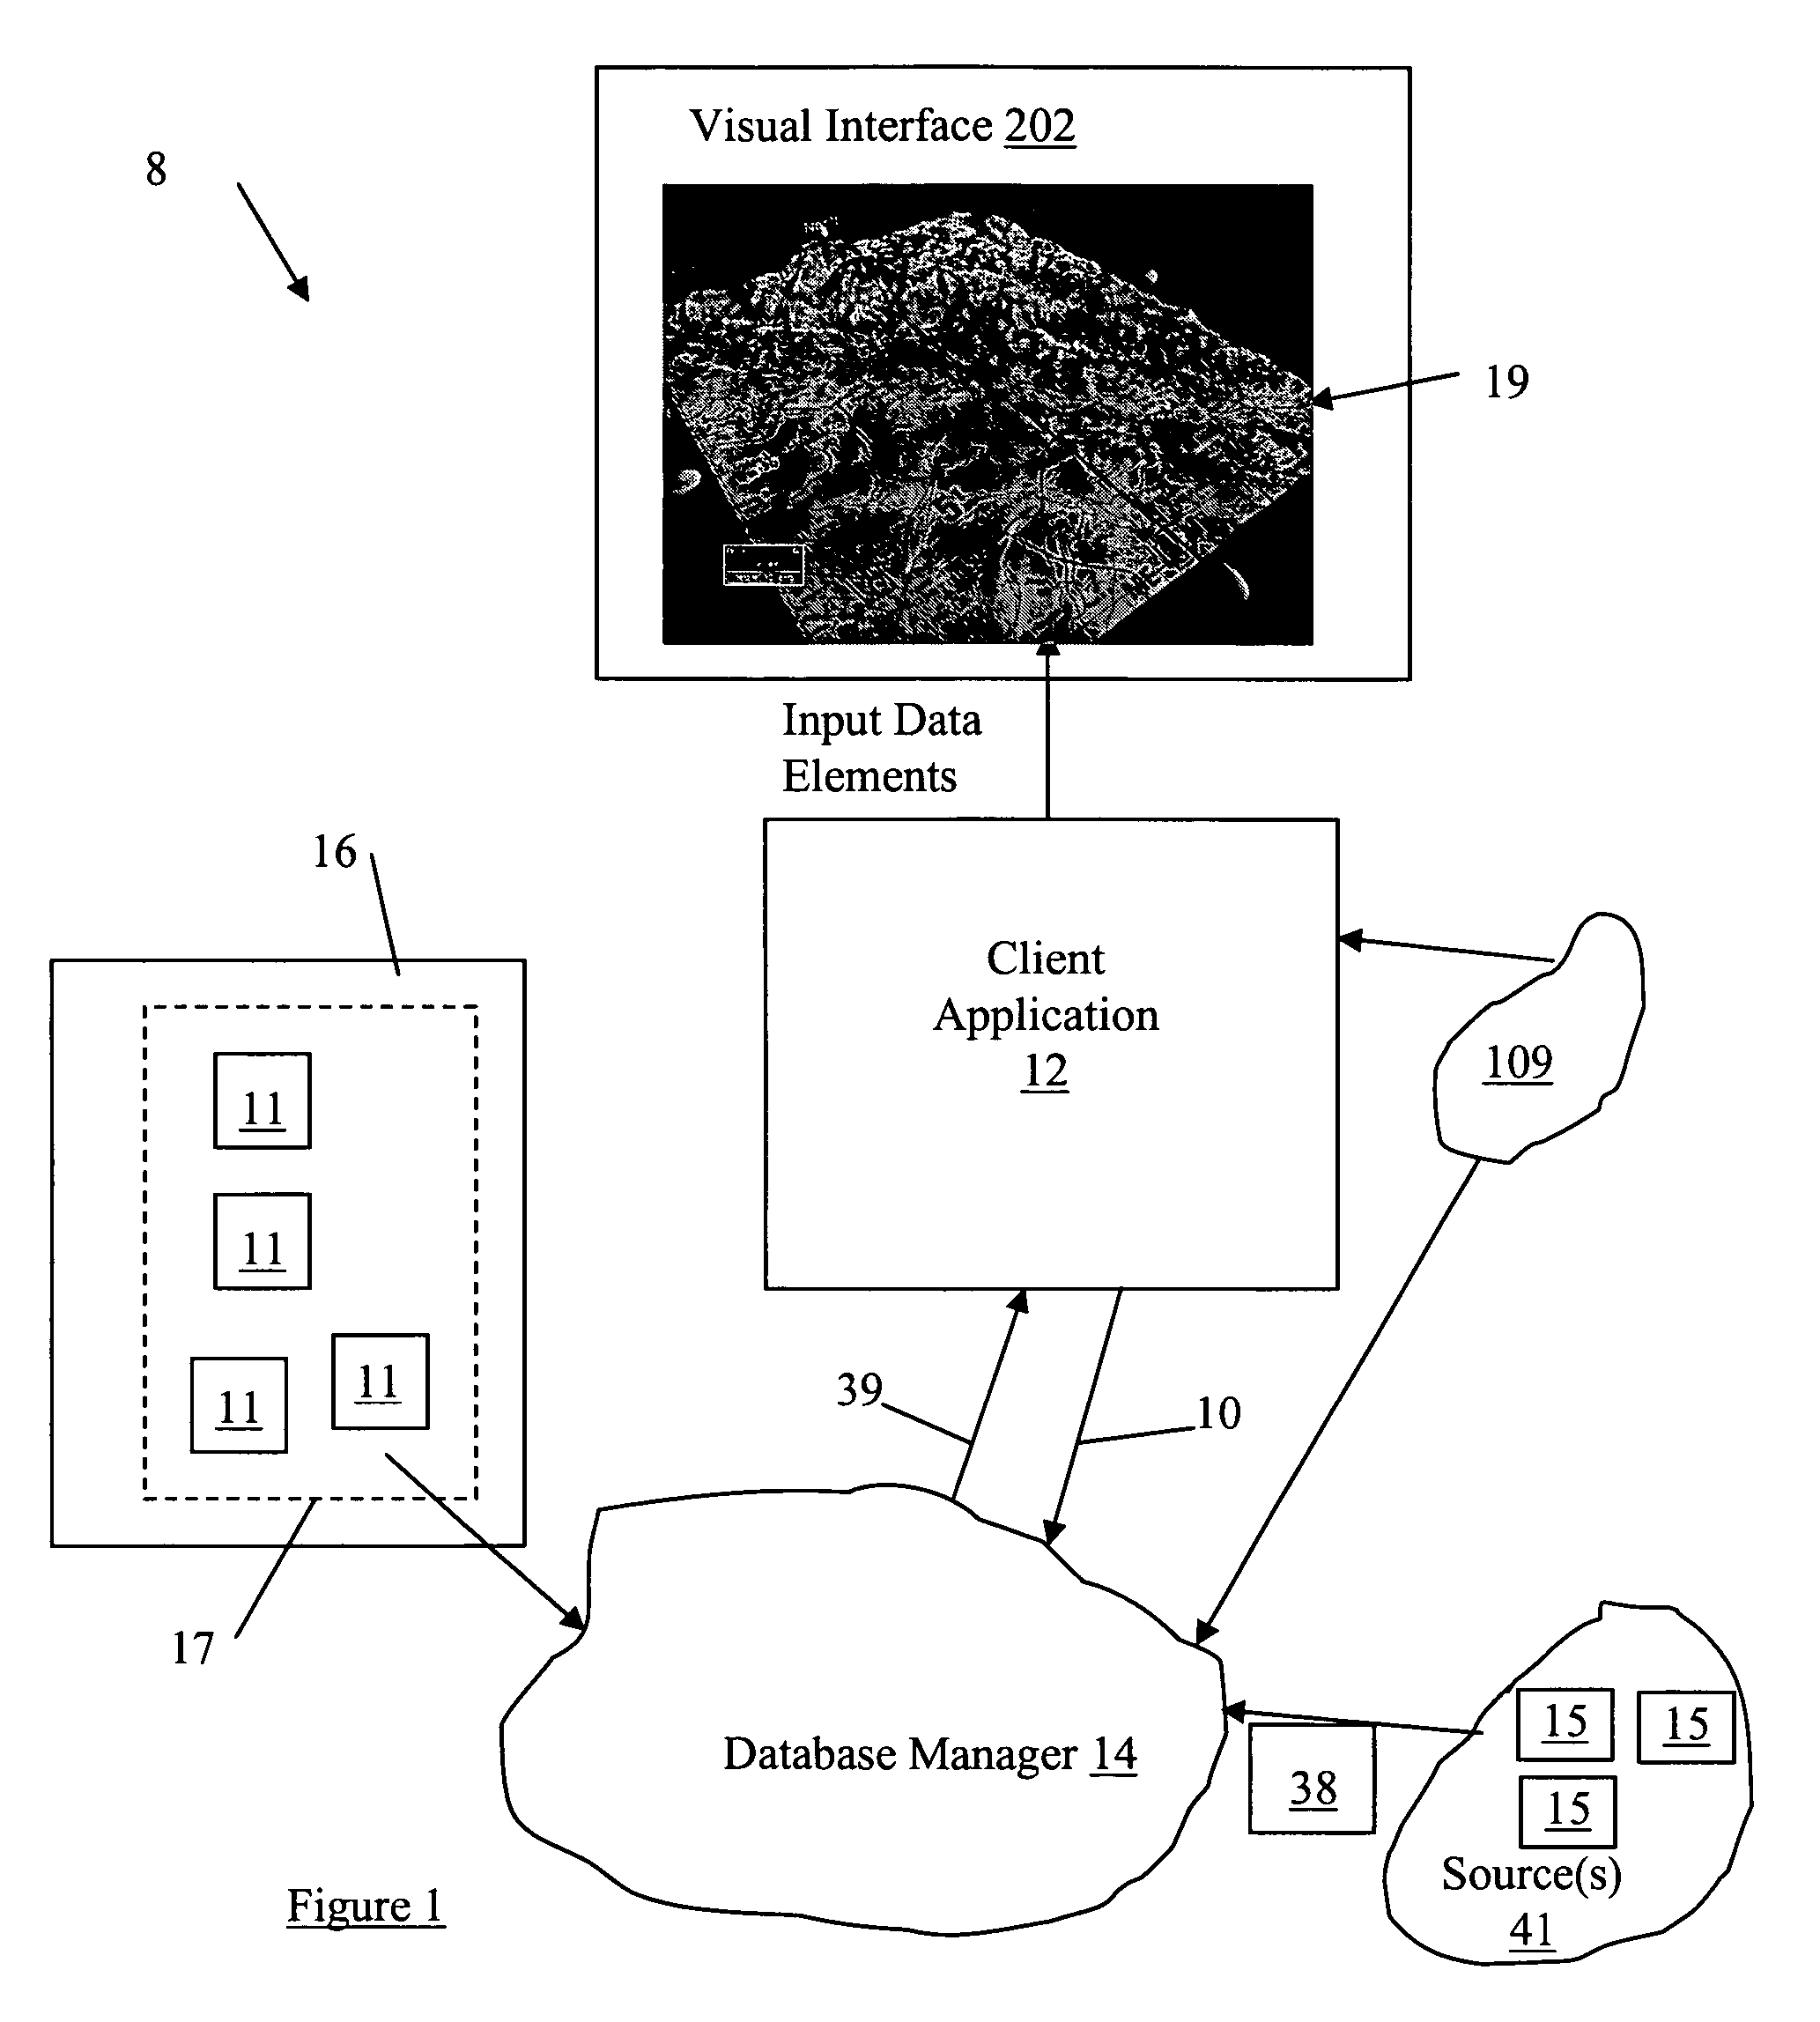
[0027] Referring to FIG. 1, a graphics delivery system 8 includes a client application 12 (e.g. a visualization tool) for manipulating a collection of data objects 15 stored in a data store 16 as tiles 11 (otherwise referred to as image segments or portions). The tiles represent geographic region portions and associated information of a complete geographic data set 17, are used as input for map-based and associated data elements supplied to a visual interface 202, and are stored as a series of layers 200 (see FIG. 6), as further described below. The geographic data set 17 can include data object 15 types such as but not limited to imagery, terrain, vector, and annotation for both aerial- and satellite-based images. Selected ones of the tiles 11 from the complete geographic data set 17 are combined by a data store manager 14, as further described below, to generate a desired visual representation 19 of the geographic data set 17 (or portion thereof) on the visual i...


PUM


Abstract

A system and method is provided for assembling graphics information as a graphics display for presentation on a visual interface, the graphics information including a plurality of image tiles stored in a data store. The system and method comprise a management module for receiving a graphics request message and for coordinating processing of a selected number of the image tiles to generate at least one representative image tile as the graphics display in response to the graphics request message. The system and method also comprise a graphics system coupled to the management module for receiving processing information from the management module to facilitate access to the selected number of the image tiles. The selected number of image tiles are processed as a combination to generate the least one representative image tile, such that the graphics system includes graphics hardware such as a GPU / VPU configured for processing the graphics information.

Description

[0001] (The present application claims the benefit of U.S. Provisional Application No. 60 / 644,044, herein incorporated by reference.)[0002] The present invention relates to an interactive visual presentation of graphical data on a user interface. BACKGROUND OF THE INVENTION [0003] Internet GIS and Web mapping have been applied in homeland security, disaster management, business market, transportation, city planning, and K-12 educations. According to a recent research from ComScore Network [0004] ((http: / / www.ebrandz.com / newsletter / 2005 / July / 1july—31july_article1.htm), online map users are a huge market. Currently, Time Warner's MapQuest.com had an estimated 43.7 million U.S. visitors in May 2005, the Yahoo! Maps had 20.2 million users, Google Map had 6.1 million users, and Microsoft's MSN MapPoint had 4.68 million visitors. This is a huge market for mapping services providing more diversified geospatial information services. [0005] The maps presented by these web sites (and other ma...

Claims


Application Information

Patent Timeline
Patent Type & Authority Applications(United States)
IPC IPC(8): G06F12/10G06T17/05
CPCG06T3/40G06T17/005G06T17/05G09G5/14G09G5/34G09G5/391G09G2340/12G09G2360/121G09G2370/027G06T11/40
Inventor BETHUNE, CHRISTOPHERECCLES, RYANKAPLER, TOM
Owner UNCHARTED SOFTWARE INC
Why Eureka
Try Eureka