Method to determine the degree and stability of blood glucose control in patients with diabetes mellitus via the creation and continuous update of new statistical indicators in blood glucose monitors or free standing computers

a blood glucose control and patient technology, applied in the field of determining the degree and stability of blood glucose control in patients with diabetes mellitus, can solve the problems of misleading the health care provider as well as the patient, affecting the accuracy of blood glucose control, and often providing information of limited utility by average glucose calculation

Inactive Publication Date: 2007-01-11
ROCHE DIABETES CARE INC
View PDF0 Cites 229 Cited by
  • Summary
  • Abstract
  • Description
  • Claims
  • Application Information

AI Technical Summary

Benefits of technology

[0044] Our approach eliminates the “double counting” of tests close in time and simulates the natural creation of hemoglobin A1c in the blood. For example, as exposed in FIG. 3, if 2 (or more) consecutive, hig

Problems solved by technology

For example, if a blood glucose test is done during a hyperglycemic episode, with a blood glucose value of 190 mg/dl, followed by another glucose test during a hypoglycemia episode with a glucose value of 40 mg/dl, the 115 mg/dl average of these two tests may erroneously indicate reasonably

Method used


Image

  • Method to determine the degree and stability of blood glucose control in patients with diabetes mellitus via the creation and continuous update of new statistical indicators in blood glucose monitors or free standing computers
  • Method to determine the degree and stability of blood glucose control in patients with diabetes mellitus via the creation and continuous update of new statistical indicators in blood glucose monitors or free standing computers
  • Method to determine the degree and stability of blood glucose control in patients with diabetes mellitus via the creation and continuous update of new statistical indicators in blood glucose monitors or free standing computers

Examples


embodiment

Preferred Embodiment and Method

[0057] The following methods are designed for a blood glucose meter implementation. A recursive method is used to compute the standard deviation and other indicators in order to minimize the required processing power and memory of the device used. This is an important consideration when the device is a blood glucose meter but only of marginal importance if the device is a general purpose computer.

[0058] 1. Method to compute Indicator #1. Time Averaged Glucose

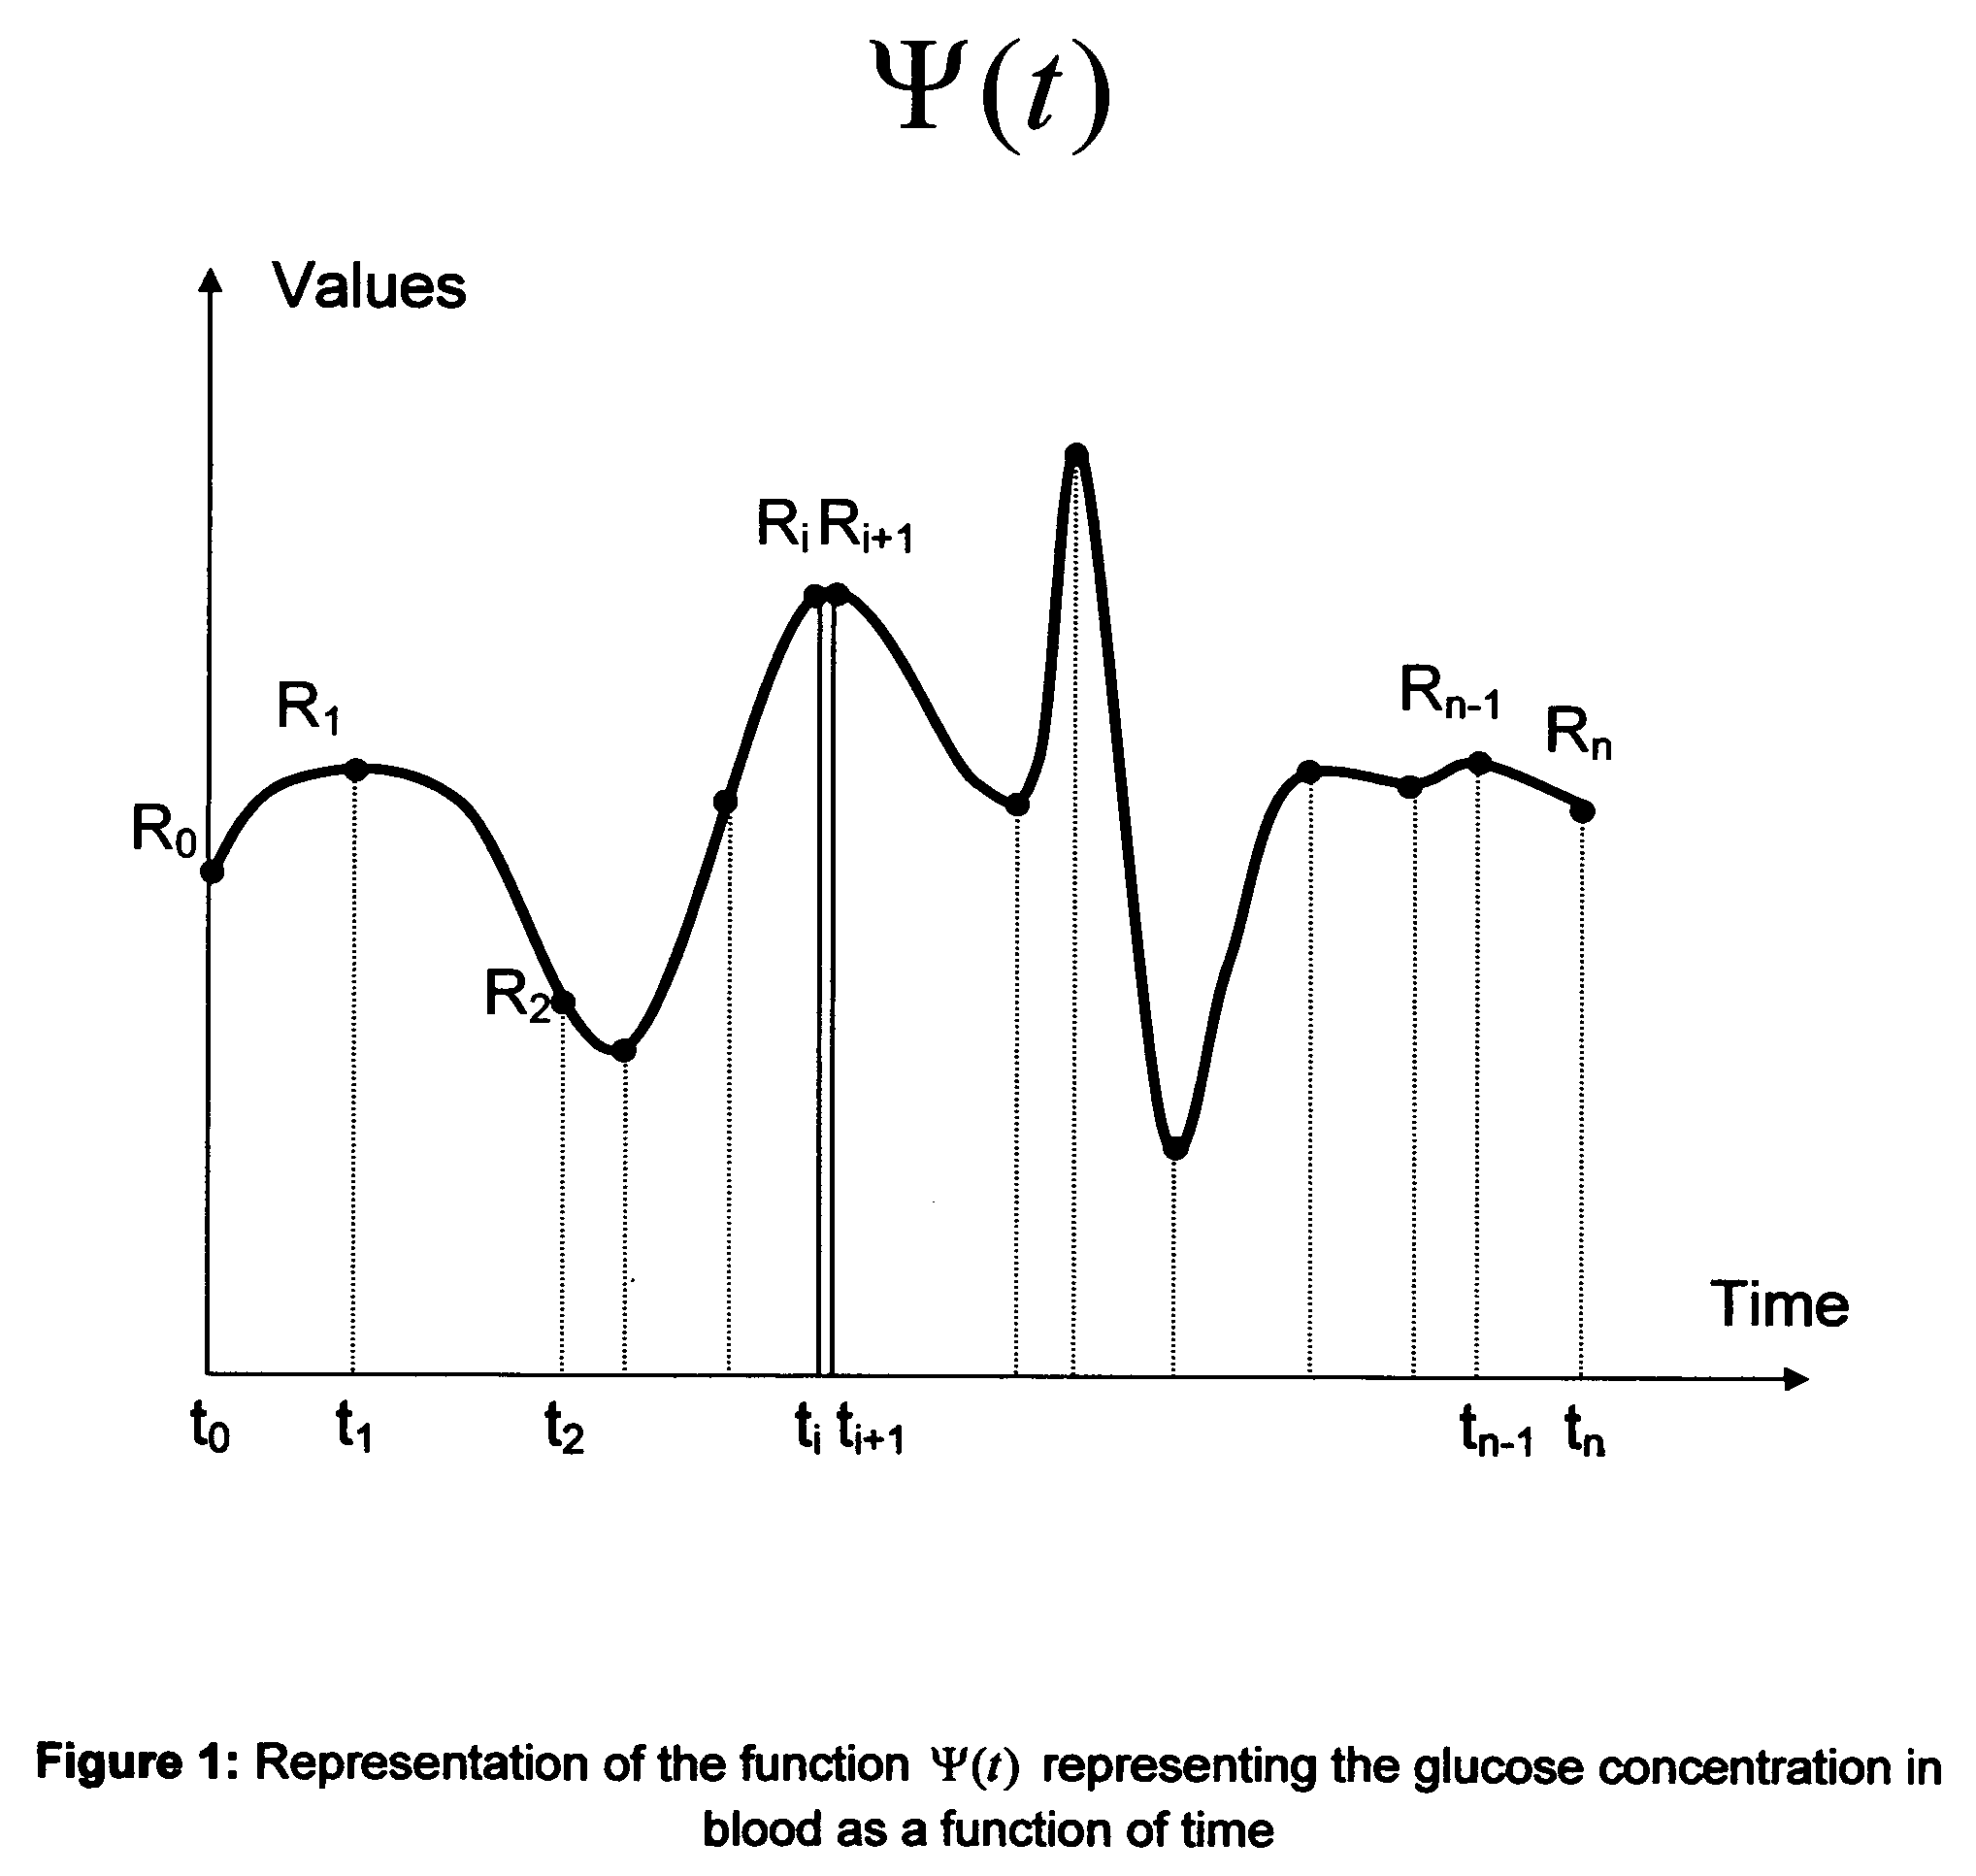
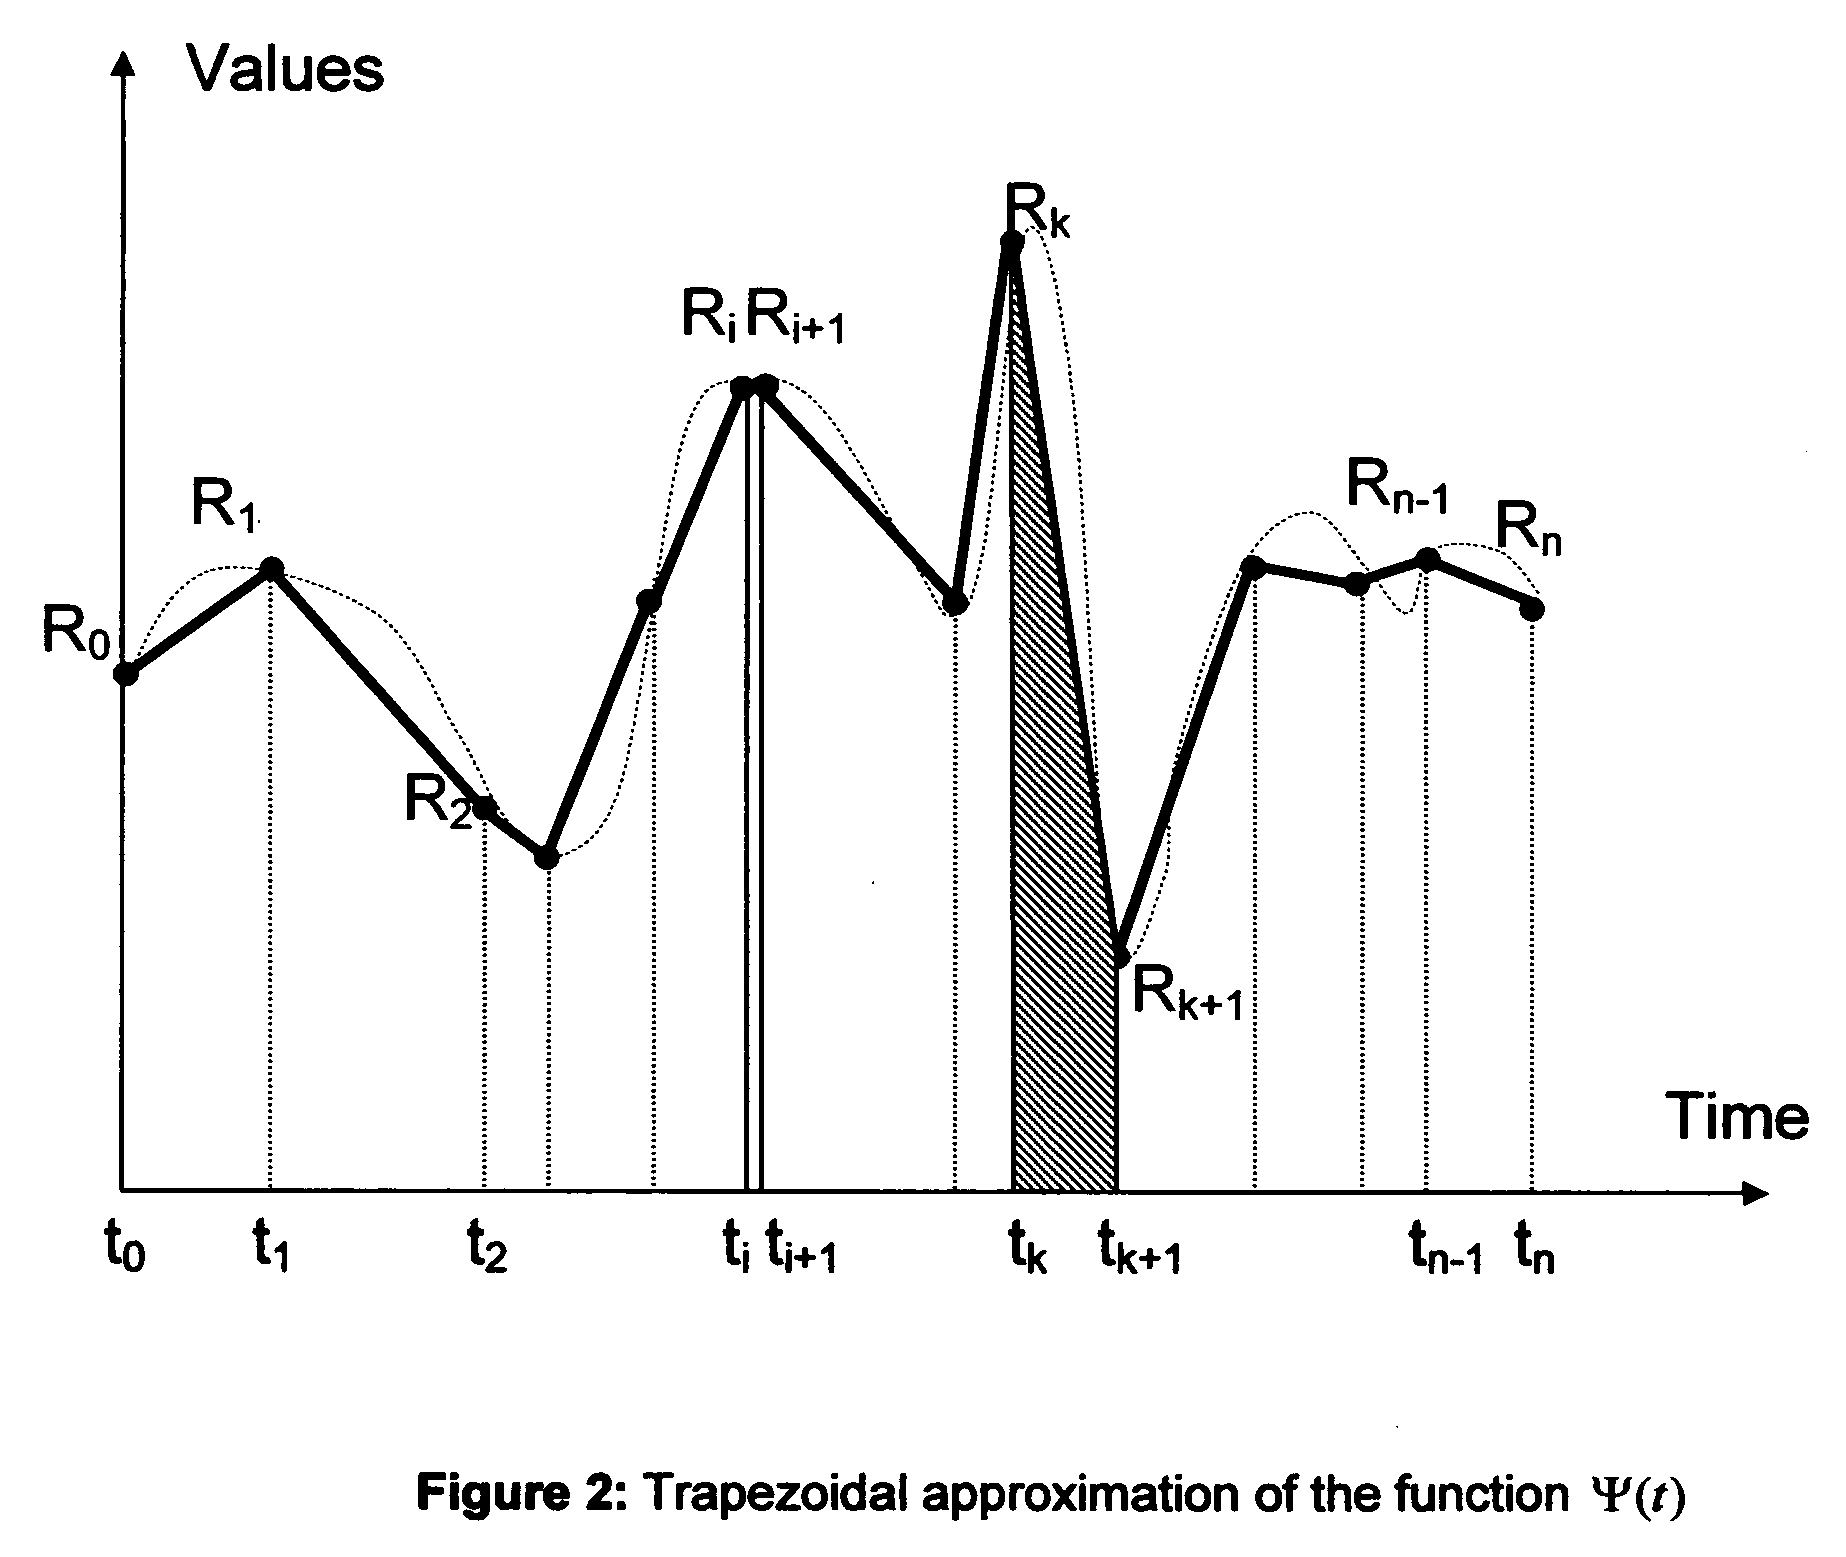
[0059] This iterative method is utilized to compute indicator #1 which represents the mathematical average of the test value as a function of time. As seen earlier A* is given by the equation: A*=12⁢(tn-t0)⁢∑k=0n-1⁢(Rk-Rk+1)⁢(tk+1-tk)(3)

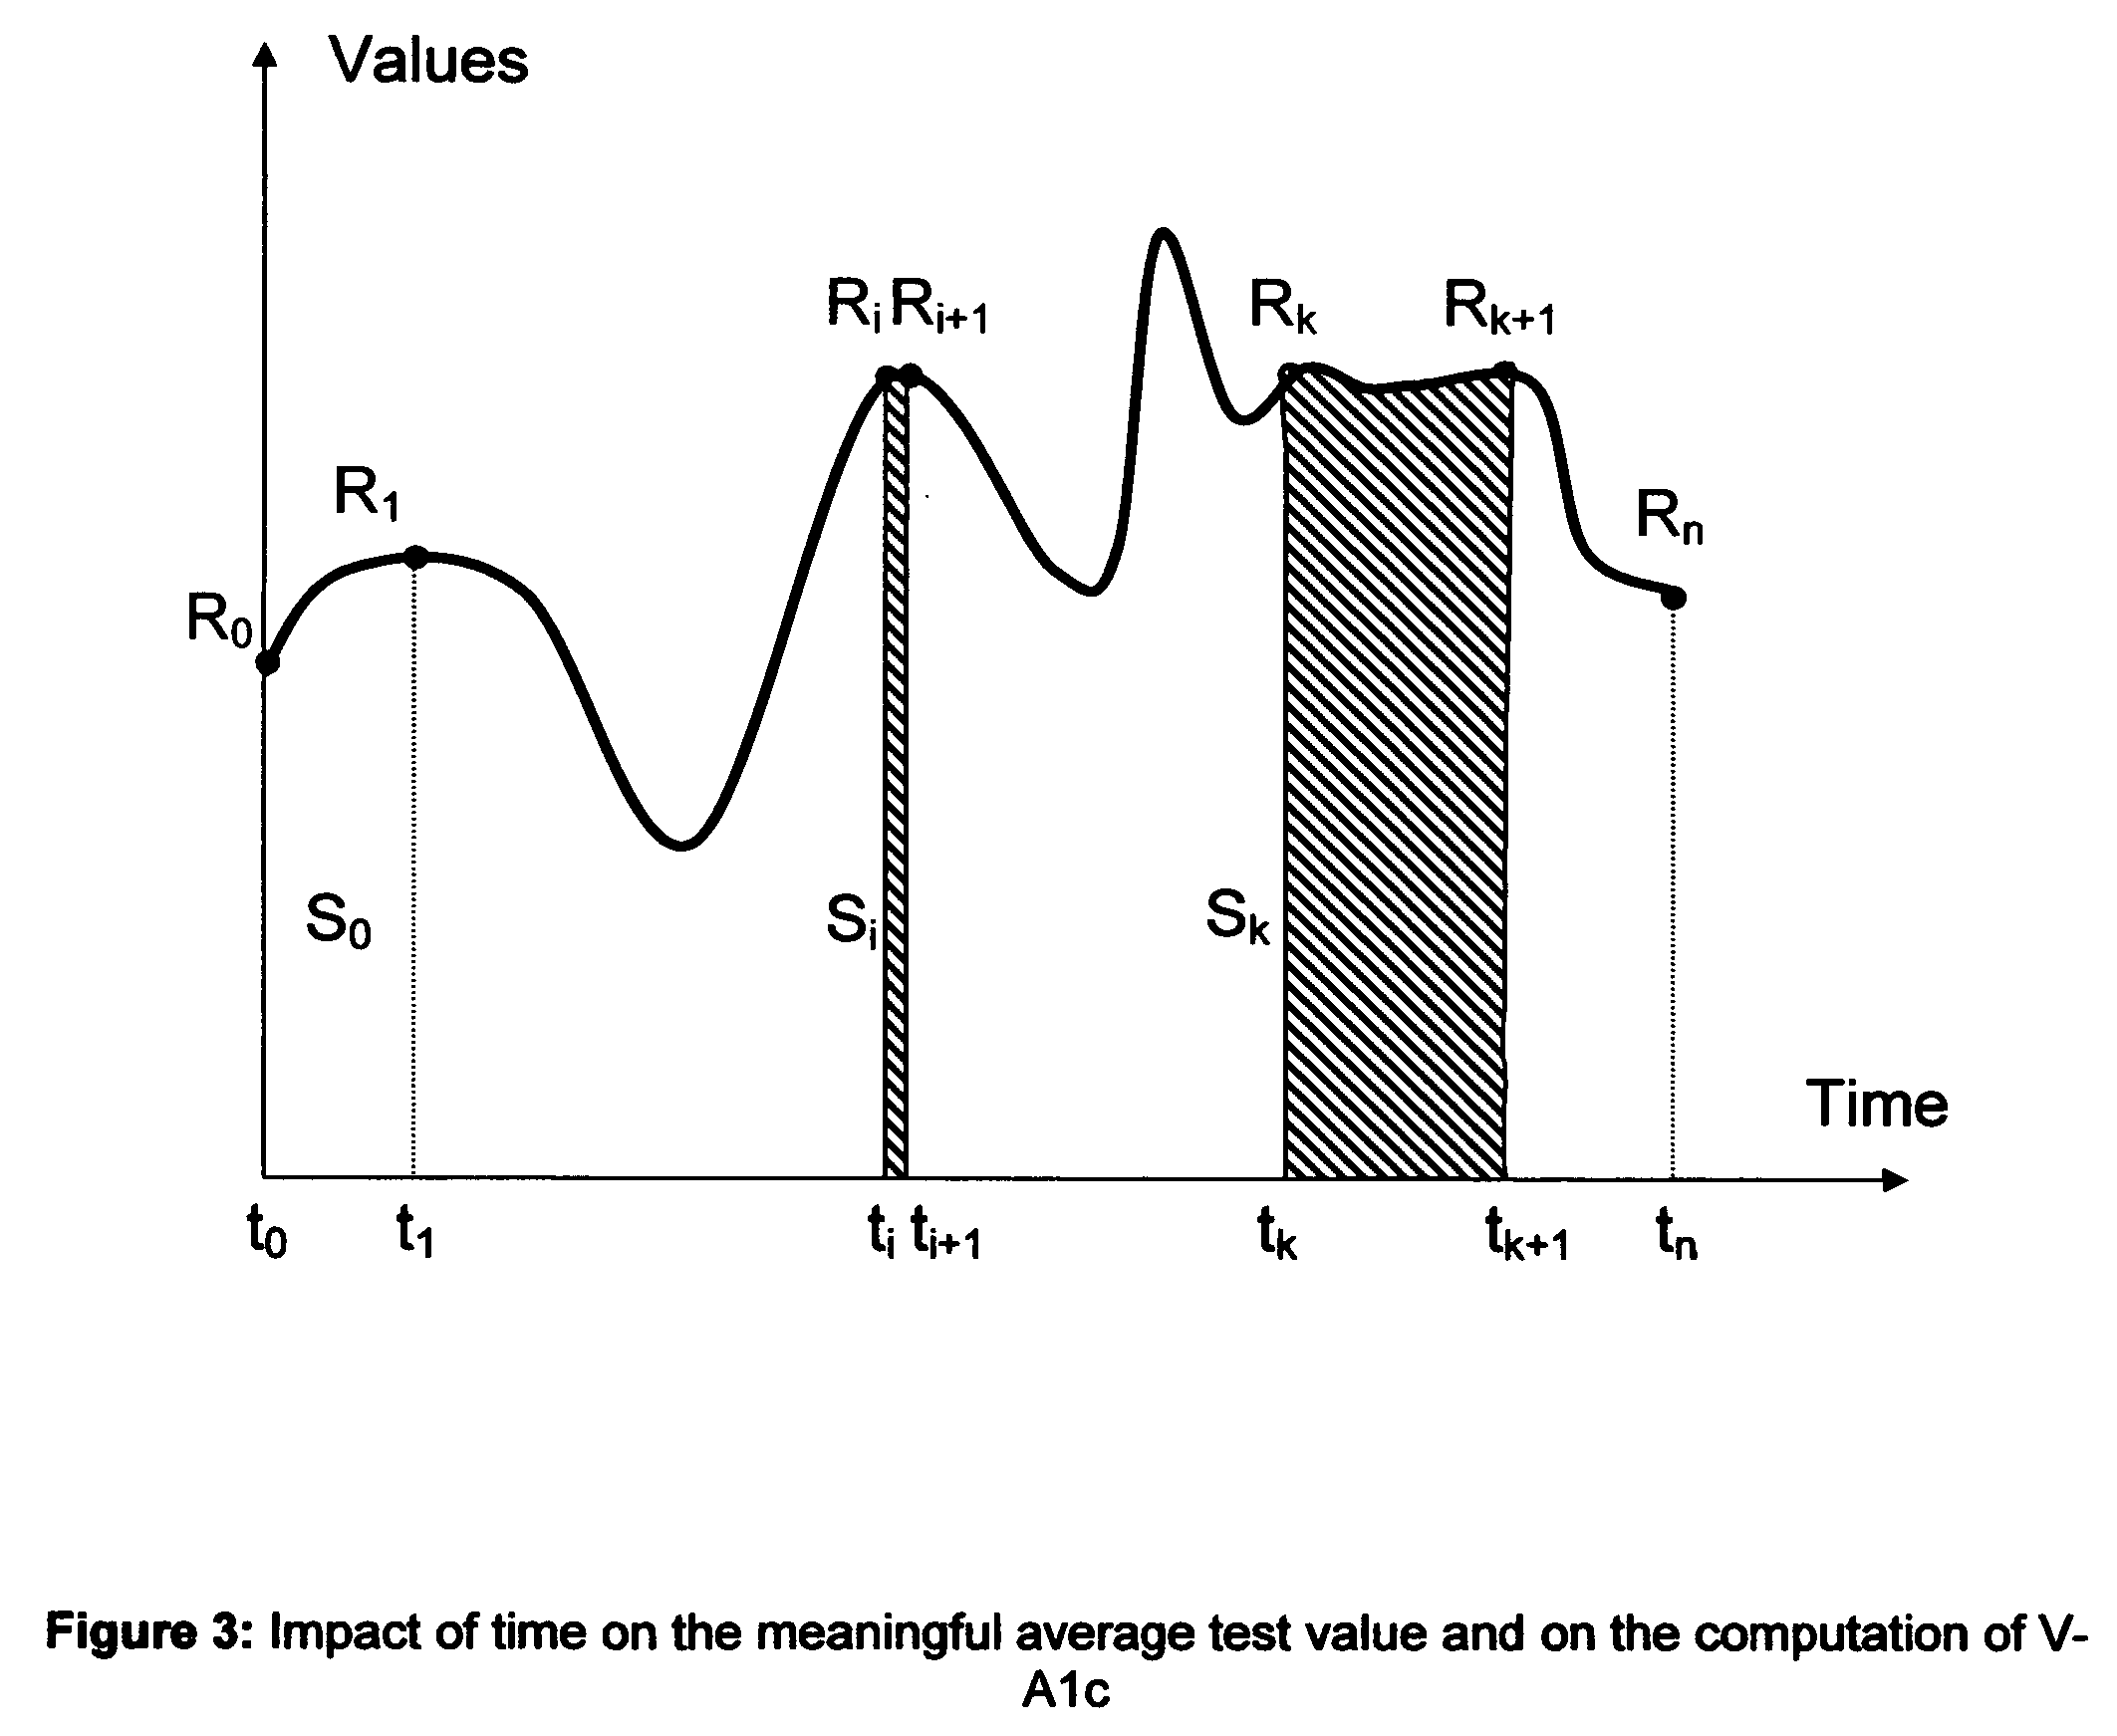
[0060] The direct computation of A* is impossible in a blood glucose meter, but it presents no difficulty in a general purpose computer. We will call Ak* the value of the indicator A* after the test # k. We have: Ak*=∑i=0k⁢Si(tk+1-t0)(9)

where Si is the area of ...


PUM


Abstract

Microvascular complications of diabetes mellitus are closely related to blood glucose levels and fluctuations. The Glycostator statistical package was created to allow patients and health care providers simple access to “glycemic indicators” which permit a “snapshot view” of the effectiveness of the patient's diabetes management program. Glycostator functions provide a simple way of enhancing the information already provided by home blood glucose monitoring devices. To this end, a set of new indices, including one called the Virtual A1c, are computed in a recursive fashion from blood glucose test results to provide a more meaningful day-to-day assessment of glycemic control. All indices can be made available at the meter user interface on request. The displayed indices allow patients to improve glycemic control by identifying problems with blood glucose control and lability that are less easily recognized in traditional blood glucose meter statistical packages. Virtual A1c emulates hemoglobin A1c continuously and provides better day-to-day assessment of long term glycemic control than does the traditional average blood glucose report. The method for computing each of these indices, including the Virtual A1c, allows for their implementation in commercial blood glucose monitors.

Description

[0001] This application continues from provisional application Ser. No. 60 / 632,585 filed on Dec. 03, 2004.BACKGROUND OF THE INVENTION [0002] 1. Field of Invention [0003] The present invention uses new computed statistical indicators to assess the blood glucose control of patients with diabetes over a period of a few months, and allows for the incorporation and the computation of these indicators in the data screens of devices such as blood glucose monitors. The indicators computed from blood glucose test results include a Time Averaged Glucose (TAG) parameter, a simulation of the measurement of hemoglobin A1c called the Virtual A1c (V-A1c) and an indicator of blood glucose variability called the Lability Factor (LF). The method and the set of these indicators are called Glycostator. These indicators are functions of the patient's blood glucose test results over a specific period of time, as well as of the elapsed times between all these tests. The first new indicator is the Time Ave...

Claims


Application Information

Patent Timeline
IPC IPC(8): G06F19/00
CPCA61B5/14532
Inventor ABENSOUR, DANIEL S.HARRELL, R. MACK
Owner ROCHE DIABETES CARE INC
Why Eureka
Try Eureka