While much of the available
software is well suited to the needs of complex IT or
engineering projects, there is nothing that effectively targets the needs of middle / junior managers and their superiors.
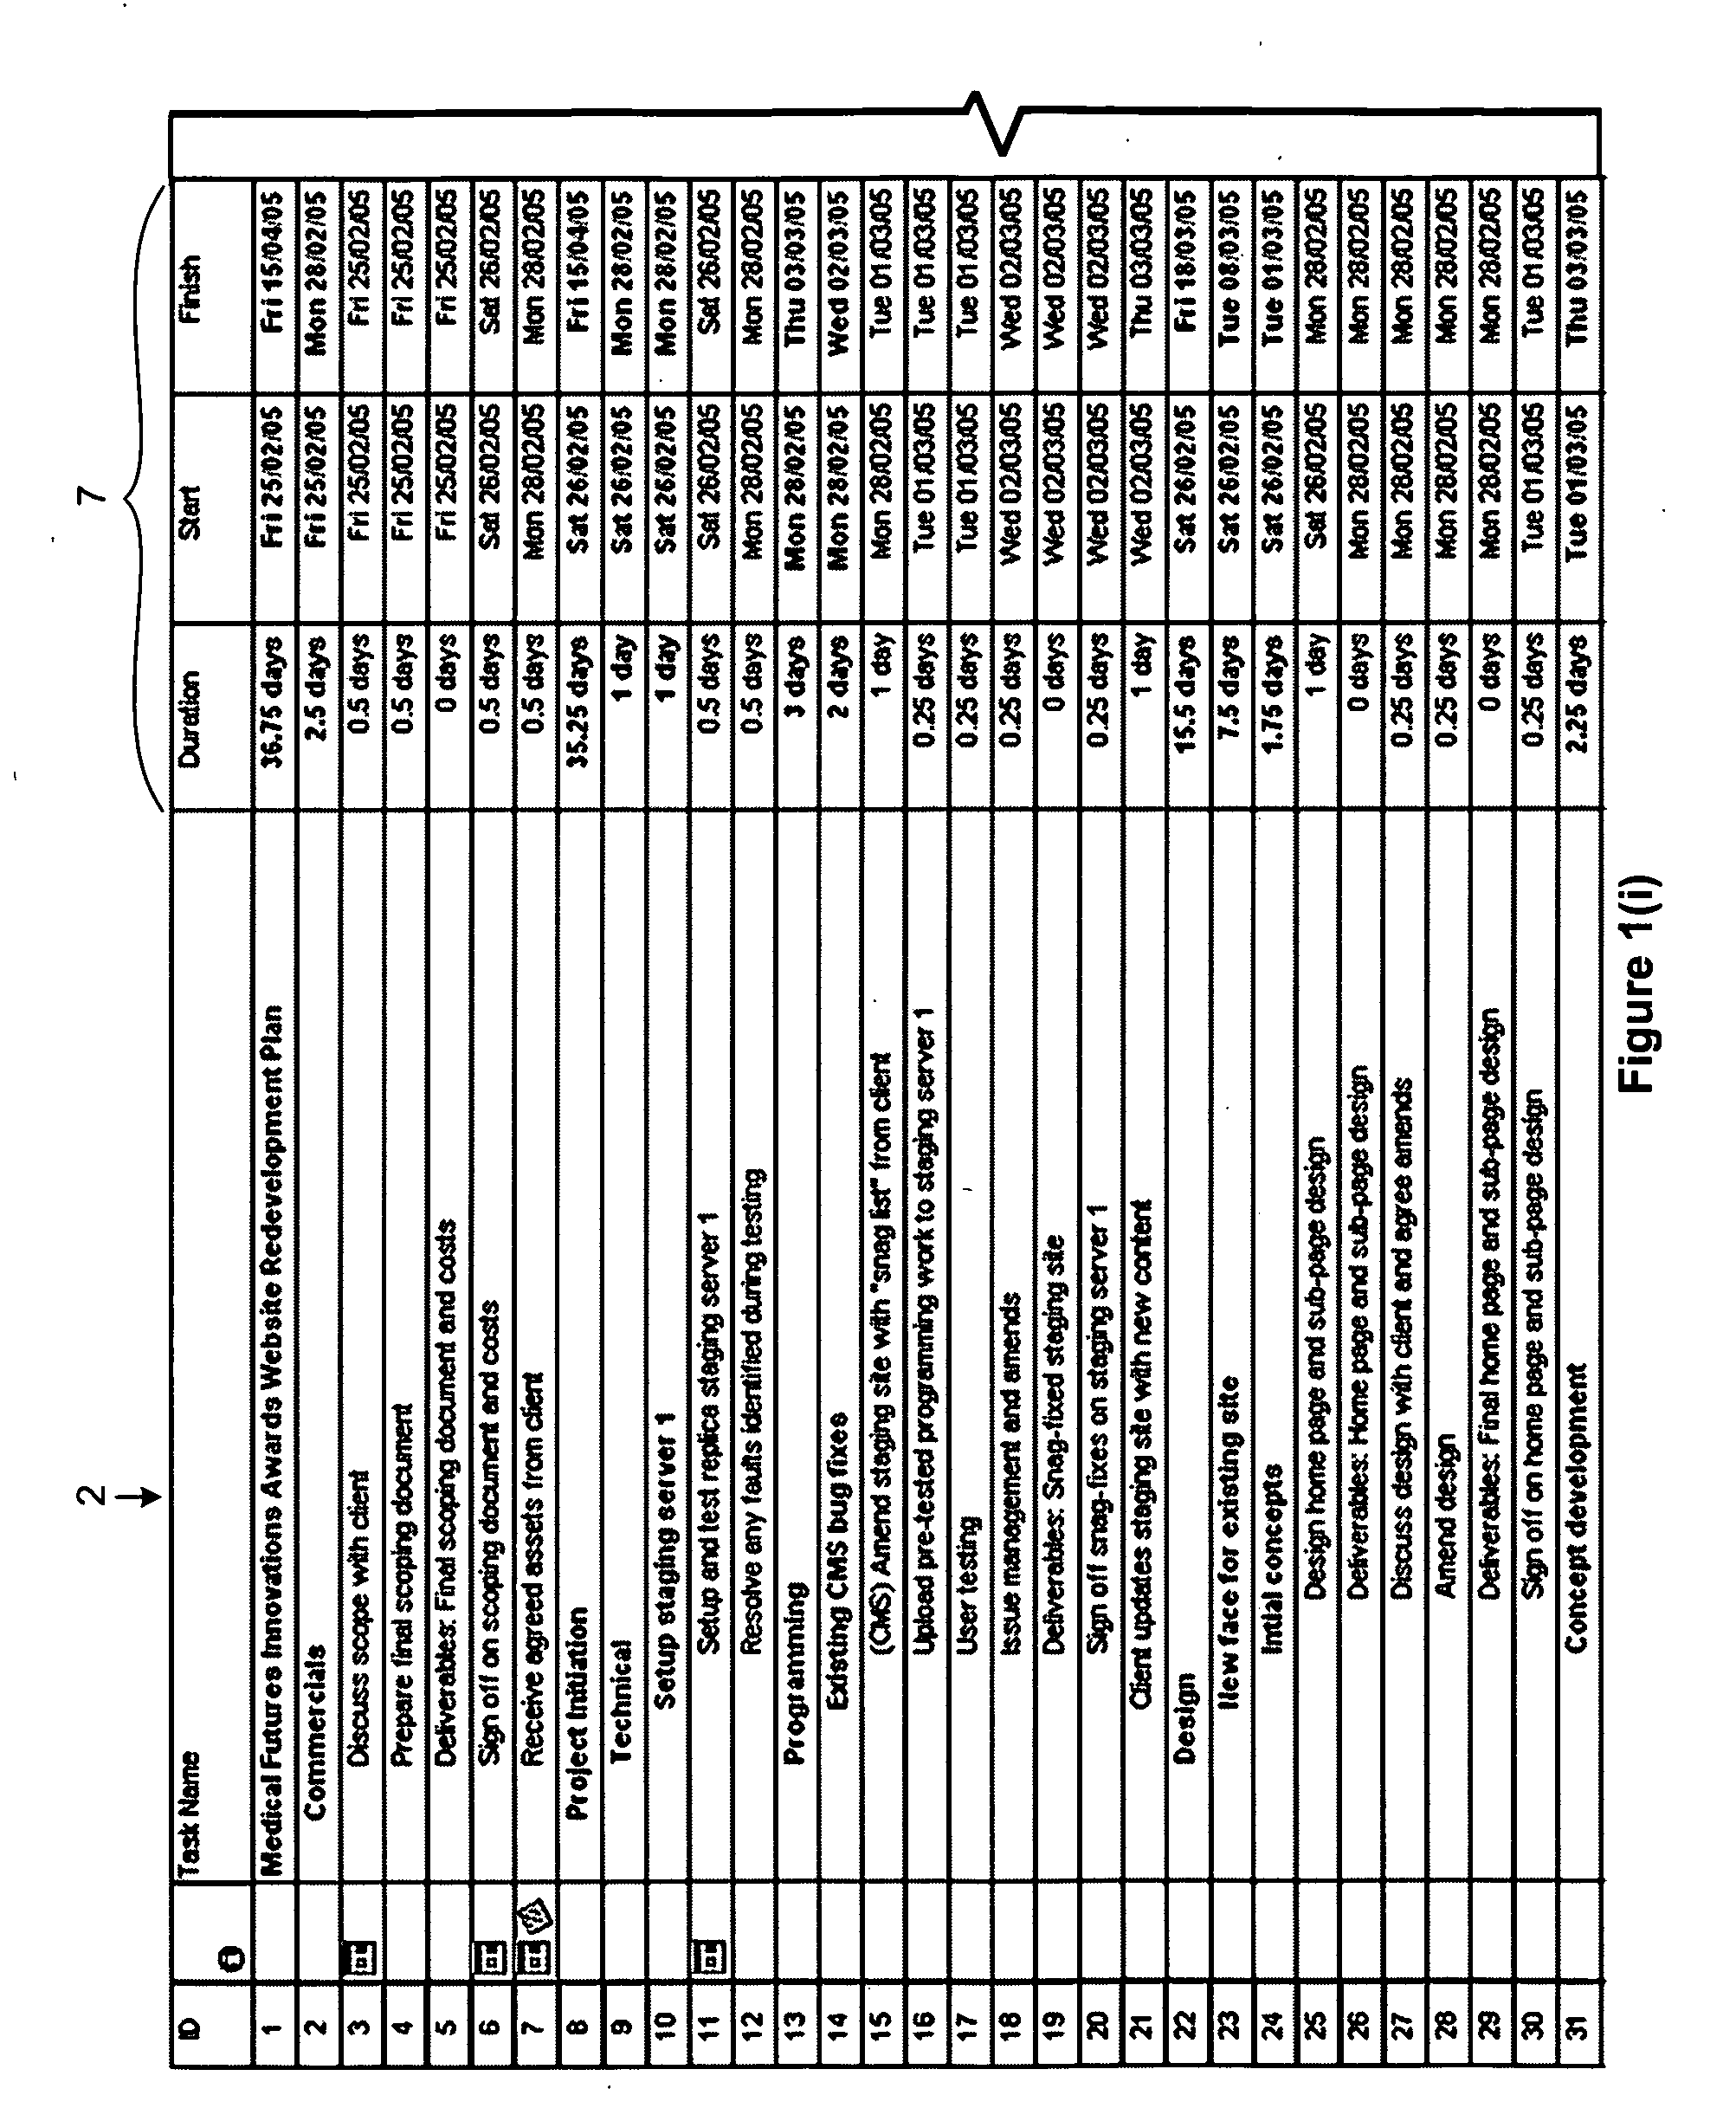
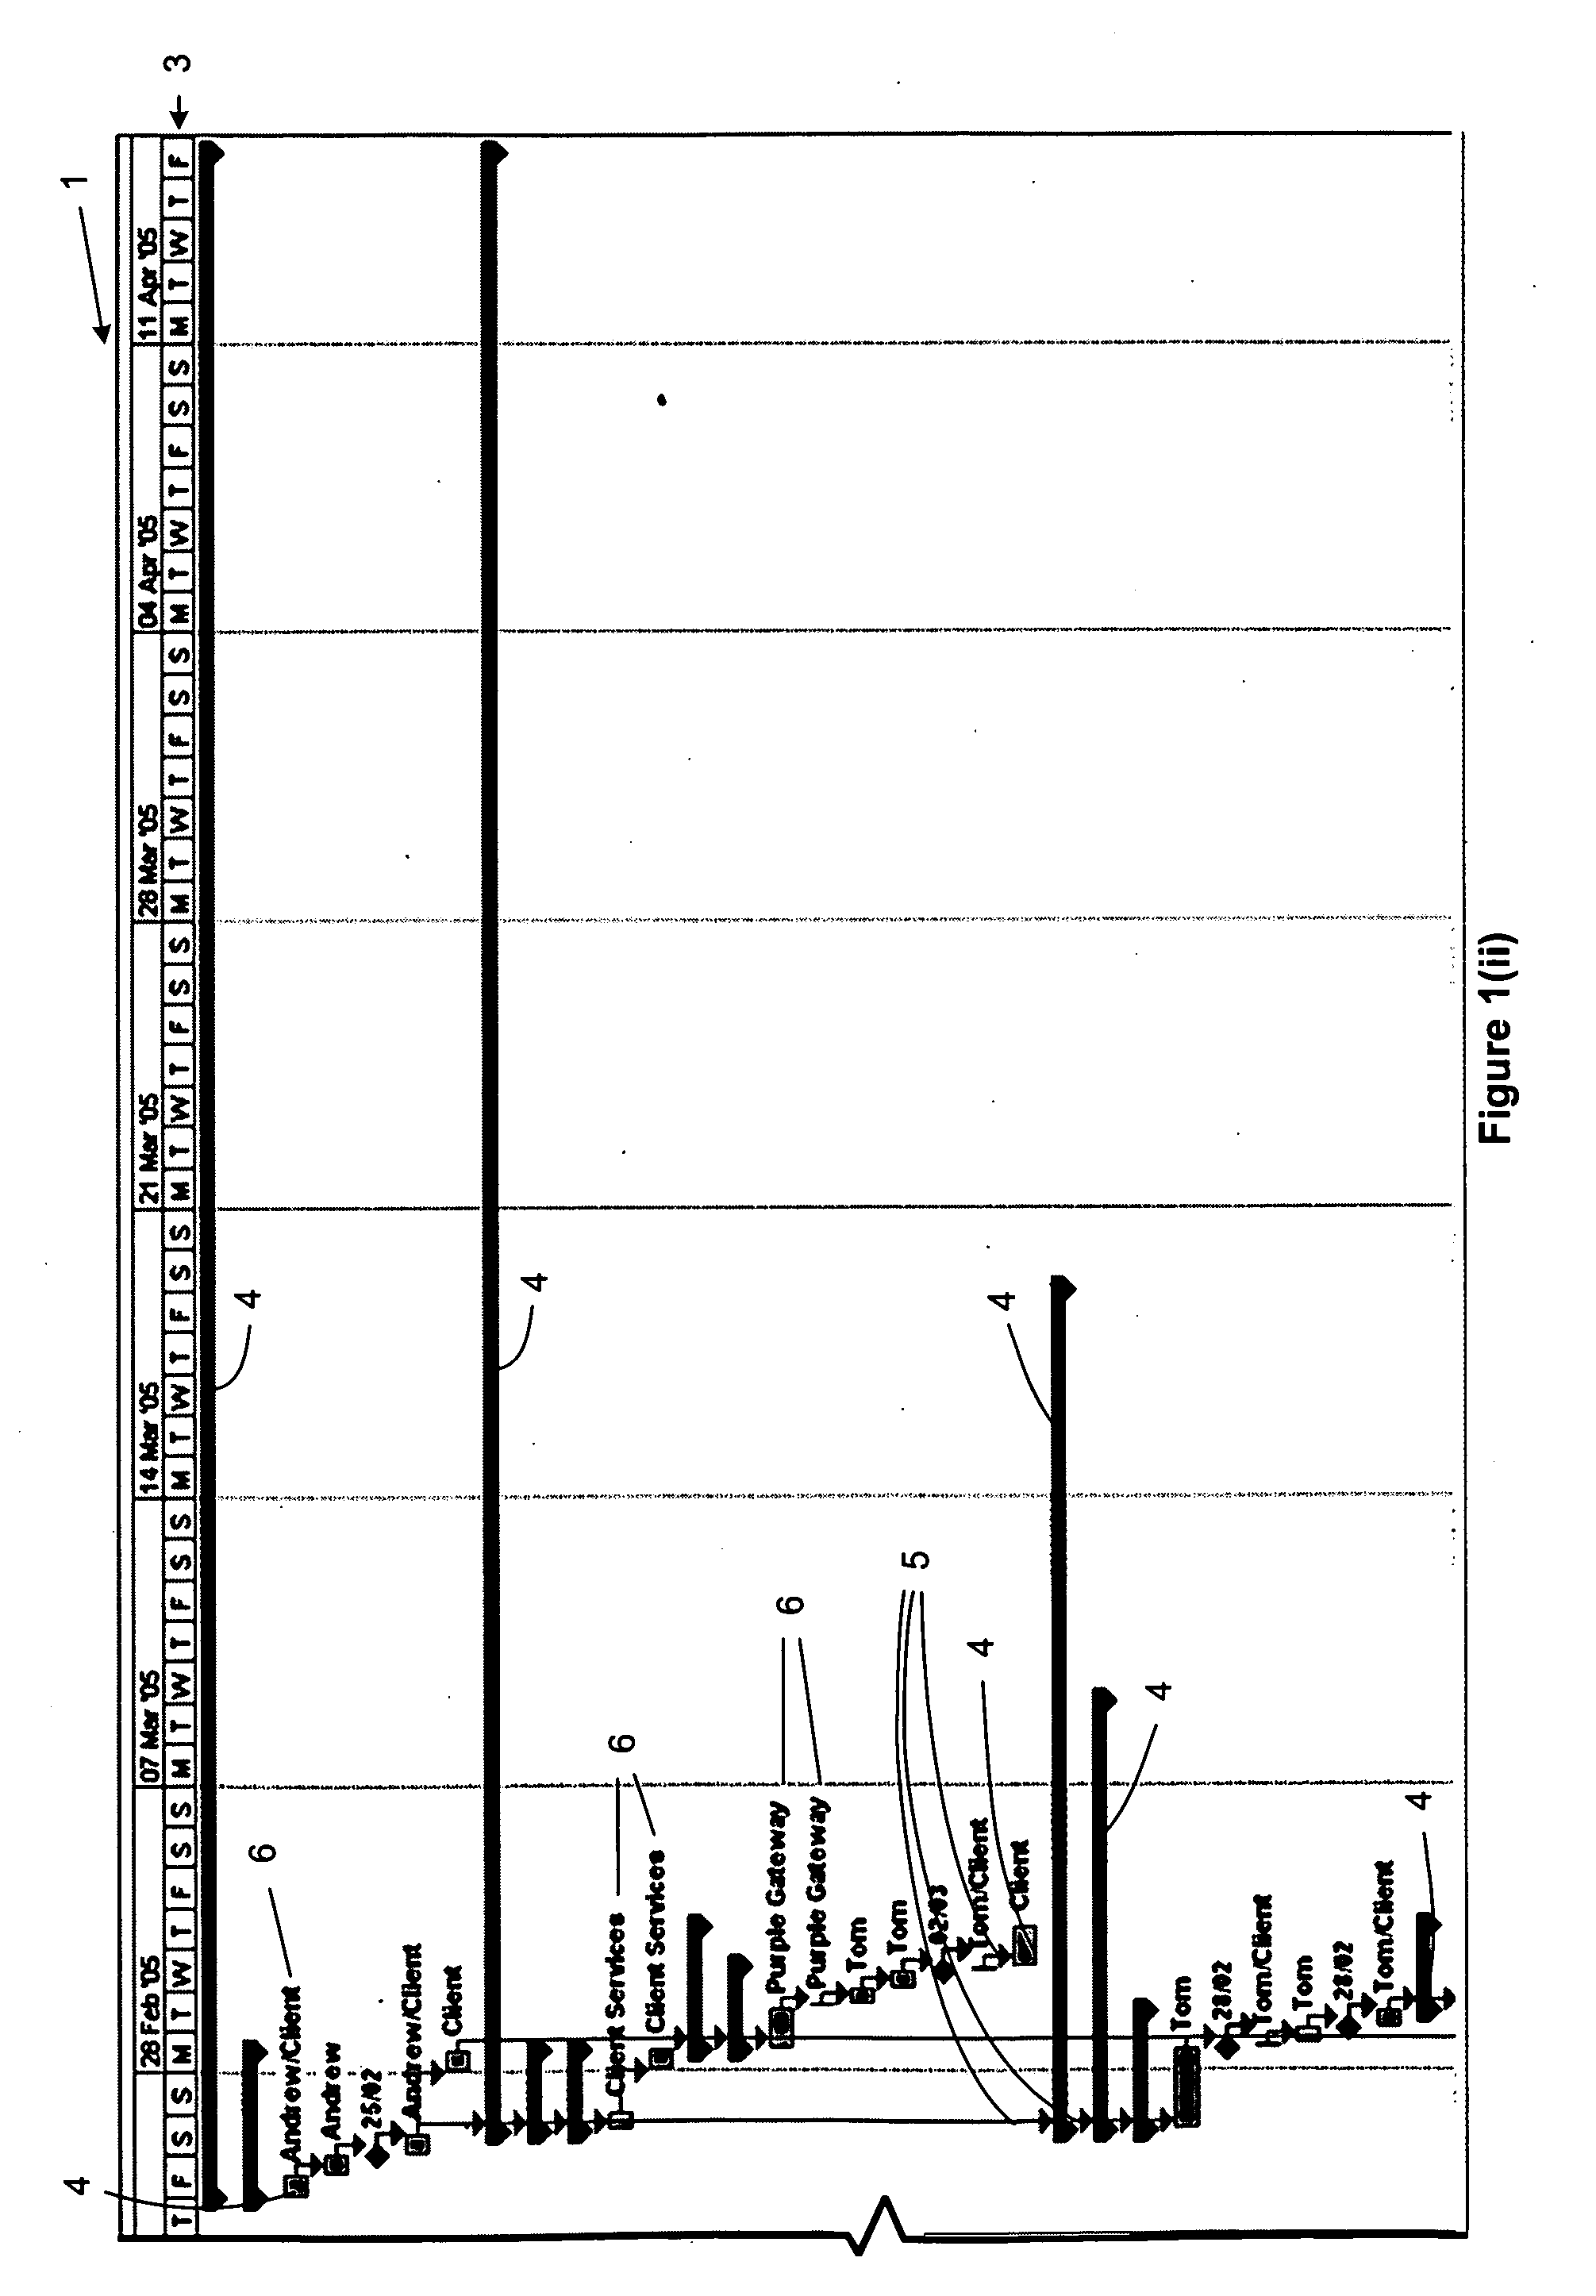
A problem with GANTT charts is that they become quite unwieldy for projects having a large number of activities.
In particular, larger GANTT charts tend not to be suitable for most computer displays, and projects are often more complicated than can be communicated effectively with a
GANTT chart.
This is a well documented problem—see for example a Wikipedia article in Annex A.
More specifically, this activity emphasis in project plans and project management
software has two significant problems:a. It contributes to a lack of
clarity about “the big picture” since firstly, the projects objectives, deliverables and measures of success may not be “kept in mind” (or developed at all) when the
project manager works on the timeline of activities, and secondly, the tendency is to develop a detailed
list of activities, and get lost in the detail, rather than develop something at a higher level which conveys the overall picture of what needs to get done.b. It encourages an activity mindset rather than a “deliverables” or output-focused mindset.
This
deliverable focus, or “product based planning”, is present in some software tools as a WBT (
Work Breakdown Structure), but the tools tend to be too complex for the target users and they don't tie the activities to the deliverables in one view to ensure they are kept in mind.
This
dual focus on content (what should we be doing?) and formatting (how can I make this fit on a page / look good?) distracts from clear thinking when creating a plan and the formatting requirements can be very
time consuming.
Many managers find GANTT charts (either in software tools or if made in Excel® or PowerPoint®) hard to update quickly, often because the original plans have been quite detailed, and it is very common for the plan to fall into disuse as a project progresses.
When plans are updated, it can be very time-consuming especially if the
project manager is using both a
GANTT chart in Excel® (or other software) and PowerPoint®.
By adding extra columns to the timeline to add the extra month, the horizontal vs
vertical dimensions of the
GANTT chart will have changed which may lead to formatting issues when pasted into PowerPoint®, and therefore require additional work to get it to look “right”.b. If the project timeline / GANTT chart has been created in PowerPoint®, then the user will likely have to resize and move every element on the chart which, for a timeline of any complexity, can literally take hours.
The need to tailor a plan (or presentations) for different audiences places a significant burden on the
project manager.
There are several problems with this approach.
Firstly, if the project manager is keeping the plan up to date the retyping of meeting action points is “double work” and a waste of valuable time.
Secondly, where the plan falls into disuse, the team may lose
sight of the big picture, start to overlook other things they should be doing and generally go off track.
Thirdly, it also becomes harder and harder for management to provide effective oversight.
The chart may look good on the screen and on a colour printer, but when it gets photocopied or printed out in
Monochrome (typically black and white), the colour distinctions are lost and the project manager either has to proceed with printed output, which does not communicate what they want, or they have to go back to PowerPoint® and shade things differently which takes additional time and re-work.
Whilst clearly a great product for complex IT or
engineering projects and many other situations, it generally considered to be over-complex and not well suited to middle / junior management needs.
There are several disadvantages which are described below:a. It has a strong focus on
activity scheduling and resourcing but it does not directly address project level objectives, deliverables and success
metrics, nor does it directly focus on the deliverables from key activities.b. Its main output, the GANTT chart, tends to be made over-detailed by users, it does not fit to a page automatically, it is not in a format that many people find great for communication, and there is limited flexibility to tailor the outputs for different audiences.
As a result, with this
software tool, users run into most of the problems highlighted earlier.
Overall, it is regarded by most people as “too much” and “too complicated” for the kind of projects they get involved in.
As a rule, this software is pretty similar in scope and complexity to Microsoft Project® and therefore suffers from the same associated problems, from the perspective of middle / junior managers.
However, there are many inefficiencies with their use.
For example: Excel® and PowerPoint® lack an “in built” project
management structure to guide peoples' thinking, so the user is reliant on their own capabilities and significant time can be spent even on very basic formatting issues.
Time is often wasted in creating plans in Excel®, and then recreating elements of them in PowerPoint® for communication to the team or to management; Plans made in Excel® can be hard to integrate into other products such as Word or PowerPoint® as copy / paste can lead to formatting issues (i.e. how do I get it to fit on a page?).
Further, GANTT charts made in Excel® are often too detailed and are hard to update when events during a project change, as they inevitably do.
Overall, alone, or in combination, using Excel® and PowerPoint® for project plans leads to all of the problems highlighted earlier.

