Method for measuring soil CO2 flux tidal flat wetland during early and later intertidal periods

A flux and wetland technology, which is applied in the field of measurement and calculation of soil CO2 flux in tidal flat wetlands in the morning and evening intertidal periods, can solve the problems of soil properties at the measurement point, small space below, and difficulty in walking, etc., to avoid long-term measurement of power shortage, The effect of avoiding the damage of the instrument and reducing the workload

Active Publication Date: 2014-03-05
江阴智产汇知识产权运营有限公司
View PDF8 Cites 8 Cited by
  • Summary
  • Abstract
  • Description
  • Claims
  • Application Information

AI Technical Summary

Problems solved by technology

[0005] The middle and low tide areas of tidal wetlands are muddy, sandy and rocky beaches, and more than half of the time in a day is submerged by sea water. As a result, the soil in this area generally has extremely high water content, is extremely muddy, and is difficult to walk, and even more inconvenient for a long time. The characteristics of staying, etc., especially in areas with vegetation such as mangroves, the space under it is narrow, lack of light, and poor ventilation, making it more muddy and difficult to walk
In addition, a long-term field measurement of CO in tidal flats 2 When the concentration is high, the high water content will make the modern method for measuring terrestrial soil CO 2 The accuracy and stability of the concentration-based instrument are greatly affected, and the long-term measurement has high requirements on the power supply of the instrument and the microcomputer
The most important thing is that even if it is difficult for people to carry the instrument to the area or can use the static box method for measurement, its long stay will affect the soil properties of the measurement point, and then the measured CO 2 In practice, we have never successfully measured soil carbon dioxide fluxes in low-tidal regions using existing methods

Method used


Image

  • Method for measuring soil CO2 flux tidal flat wetland during early and later intertidal periods
  • Method for measuring soil CO2 flux tidal flat wetland during early and later intertidal periods
  • Method for measuring soil CO2 flux tidal flat wetland during early and later intertidal periods

Examples


Embodiment 1

[0023] The implementation site is located in the Quanzhou Bay Mangrove Nature Reserve in Fujian Province, and it was carried out on September 8, 2013.

[0024] (1) CO 2 CO in the flux model 2 Concentration is obtained. In the middle and high tide area of ​​Luoyang Village in the upper reaches of the Luoyang River, the candela community was selected as the standard sample point. Choose to use the portable soil carbon dioxide analyzer LI-840 (LI-COR company production, USA) for CO 2 concentration determination. After the value of the instrument is stable, measure for 10 minutes every time period, and the data recording frequency is 10s.

[0025] (2) CO 2 Instantaneous CO at each time period in the flux model 2 Flux acquisition. After the measurement is completed, export the data and create a CO 2 The relationship between concentration and time, in the sigmaplot software, using the rectangular hyperbolic equation (where dependent variable y is CO 2 Concentration value, ...

Embodiment 2

[0038] The implementation site is located in Quanzhou Bay Mangrove Nature Reserve, Fujian Province.

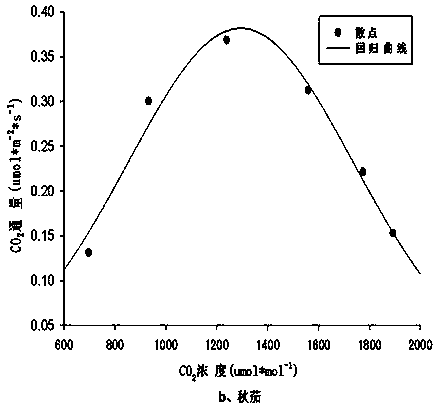
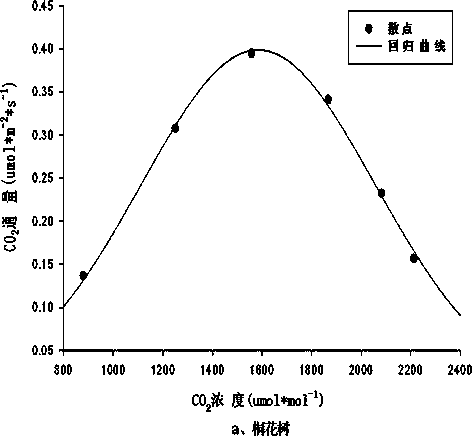
[0039] (1) CO 2 CO in the flux model 2 Concentration is obtained. In the mid-high tide area at Yutou Village in the middle reaches of the Luoyang River, the tung flower tree community was selected as the standard sample point. Select the 1h, 2h, 3h, 4h, 5h, and 6h when the tide recedes in the morning of September 9, record the moment when the tide recedes as 0h, and use a portable soil carbon dioxide analyzer LI-840 (LI-COR Company production, USA) for CO 2 concentration determination. After the value of the instrument is stable, measure for 10 minutes every time period, and the data recording frequency is 10s.

[0040] (2) CO 2 Instantaneous CO at each time period in the flux model 2 Flux acquisition. After the measurement is completed, export the data and create a CO 2 The relationship between concentration and time, in the sigmaplot software, using the rectangular ...

Embodiment 3

[0049] The implementation site of this example is located in the lower reaches of Luoyang River in Quanzhou Bay Mangrove Nature Reserve, Fujian Province. The purpose of this example is to use the model obtained in Example 1 to directly measure soil CO in low tide areas. 2 flux.

[0050] (1) Three soil CO2 values ​​were obtained quickly from three candela colonies in the downstream low tide area with a portable soil carbon dioxide analyzer LI-840 one hour after the morning tide receded on June 19, 2013. 2 concentration value.

[0051] (2) The CO in (1) 2 Concentrations brought into the soil flux under the candela colonies obtained—instantaneous CO 2 concentration formula The corresponding soil CO can be obtained 2 The flux is the predicted value, and the results are shown in Table 3.

[0052] Table 3. Soil CO in three sampling points in the low tide area 2 flux prediction

[0053]

[0054] Put three different CO in Table 3 2 Concentration corresponding to CO 2 Flux...


PUM


Abstract

The invention discloses a method for measuring soil CO2 flux in a tidal flat wetland during early and later intertidal periods. The method comprises the following steps: selecting standard sample points in medium and high tide regions of a region to be measured, measuring six groups of CO2 concentration values required for building a model, and drawing a CO2 concentration-time chart; fitting by using an equilateral hyperbolic equation to obtain a regression equation, and calculating a first-order derivative of the equation to obtain the real-time CO2 flux at time periods; performing regression analysis on a relationship between the real-time flux and the real-time concentration by adopting a three-parameter Gauss equation to obtain a model of the soil CO2 flux of the region; quickly obtaining CO2 concentration data in the region to be measured by adopting a portable soil CO2 analyzer; and substituting the obtained real-time CO2 concentration into the obtained equation model to obtain the corresponding soil CO2 flux. The method is easy and liable to implement, can be used for accurately measuring the soil CO2 flux in the tidal flat wetland during the early and later intertidal periods, and can be applied to estimation of carbon sources/sink values of a coastal wetland ecosystem and evaluation of soil efficiency.

Description

Technical field: [0001] The invention belongs to the technical fields of carbon source / sink of coastal tidal wetland ecosystem, soil efficiency ecological monitoring and global climate change, and specifically relates to soil CO 2 Flux calculation method. Background technique: [0002] Tidal flat wetlands are an important part of the coastal zone, including the entire intertidal zone, supratidal zone, and subtidal zone. The intertidal zone is the area between the high tide line and the low tide line, also commonly known as tidal flat. According to the law of tidal activity, there are three zones in the intertidal zone. High tide zone (upper zone): It is located in the uppermost part of the intertidal zone, with the upper boundary being the high tide line of spring tide and the lower boundary being the high tide line of neap tide. It is submerged by seawater for a short time, and is only submerged by seawater during high tide; mid-tidal zone (middle zone): it occupies most...

Claims


Application Information

Patent Timeline
Patent Type & Authority Applications(China)
IPC IPC(8): G01N33/24
Inventor 吴沿友王宗林邢德科王秀红尹淇淋乔韡轶赵宽朱剑昀
Owner 江阴智产汇知识产权运营有限公司
Why Eureka
Try Eureka