
Urban air quality grade predicting method based on multi-field characteristics
A technology for air quality classification and prediction method, applied in the field of air quality prediction, can solve the problems of moderate pollution, heavy pollution, unsuitability, etc., to ensure global convergence, ensure super-linear convergence speed, overcome marker bias and conditional independence hypothetical effect
- Summary
- Abstract
- Description
- Claims
- Application Information
AI Technical Summary
Problems solved by technology
Method used
Image

Examples
Embodiment
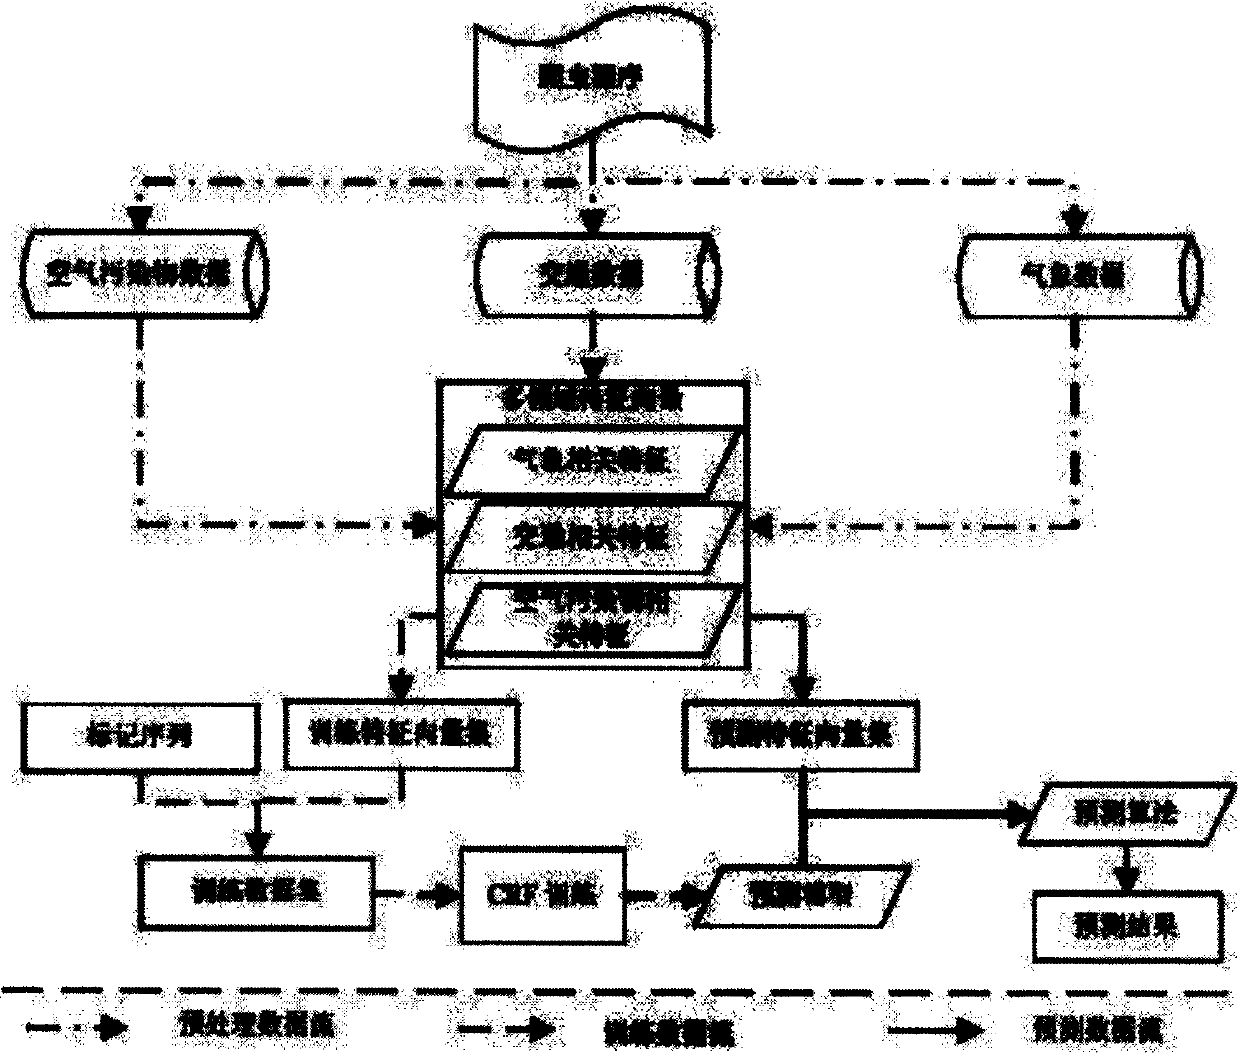
[0033] Embodiment: the present invention proposes the AQI grade prediction method based on multi-field feature, and flow process is as figure 1 shown. The method is divided into three stages: data preprocessing, training and prediction. Among them, the data flow in the preprocessing stage is represented by a dotted line, the data flow in the training stage is represented by a dotted line, and the data flow in the prediction stage is represented by a solid line.
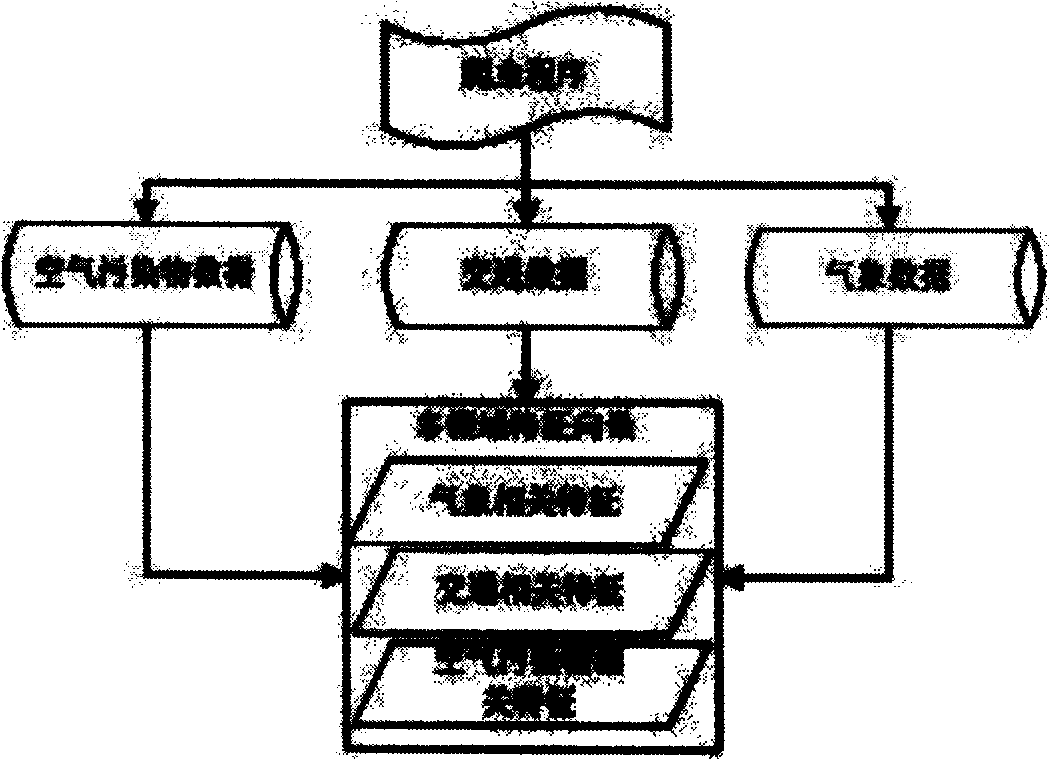
[0034] The process of data preprocessing stage is as follows: figure 2 As shown, its main steps include:
[0035] 1) For a certain city, collect historical and real-time data and meteorological forecast data for a certain period of time in the future in multiple fields that affect air quality, such as meteorology, traffic, air pollutants, etc.;
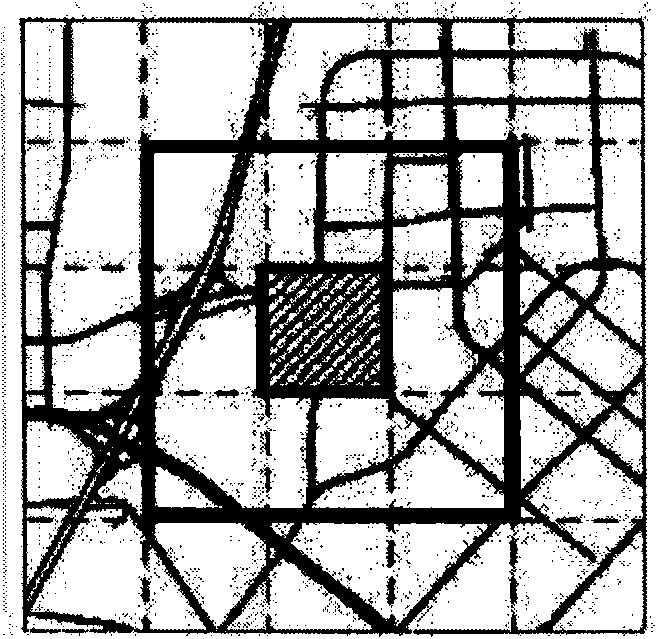
[0036] 2) Divide city a into disjoint grids, each grid g=g.wxg.h has the same length g.w and width g.h, use g. c Indicates the center point of the grid g. use g a (w, ...
PUM
 Abstract
Description
Claims
Application Information