Production forecasting method

A production forecasting and production technology, applied in forecasting, instruments, manufacturing computing systems, etc., can solve problems that cannot be corrected in real time, and achieve the effect of avoiding the expansion of deviations and correcting deviations

Active Publication Date: 2018-03-30
CHENGDU AIRCRAFT INDUSTRY GROUP
View PDF6 Cites 6 Cited by
  • Summary
  • Abstract
  • Description
  • Claims
  • Application Information

AI Technical Summary

Problems solved by technology

[0003] The purpose of the present invention is to provide a production forecasting method, which is used to solve the problem that the production management in the prior art is based on progress management and post-event analysis, and the deviation from the expectation cannot be corrected in real time

Method used


Image

  • Production forecasting method

Examples


Embodiment 1

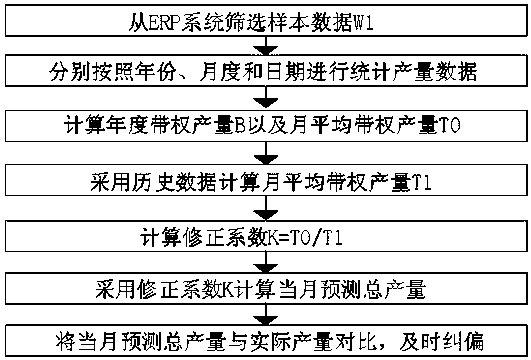
[0064] combined with figure 1 As shown, a production forecasting method, including:

[0065] Step S100: Screen out the sample data W1 from the ERP system;

[0066] Step S200: Collect the output data of the sample data W1 by year, month, and day;

[0067] Step S300: Select the output data of the past n years as the statistical sample X1, calculate the annual weighted output B and the monthly average weighted output T0, T0=B / 12;

[0068] Step S400: Select the production data of the past m months as the statistical sample X2, calculate the monthly average weighted production T1, and count the average daily production Weekday_avg on weekdays, Weekend_avg on weekends, and Holiday_avg on holidays;

[0069] Step S500: Calculating the correction coefficient K, K=T0 / T1;

[0070] Step S600: Summing up and calculating the forecasted total output P of the current month;

[0071] Step S700: Comparing the forecasted total output value P of the current month with the actual production vo...

Embodiment 2

[0075] On the basis of Example 1, in conjunction with the attached figure 1 As shown, the step S100 specifically includes:

[0076] Step S110: call the processing data of part A from the ERP system, use the part name, delivery order and receiving time as keywords to filter, and filter out the data whose receiving time is not empty;

[0077] Step S120: Further filter the data by the drawing number of the handover order to obtain the sample data W1 of part A.

[0078] working principle:

[0079] Select a class of parts from the ERP system, such as part A, as a reference, and use the same method to predict the output of other parts and components. Filter out the data whose receiving time of part A is empty, and discharge the data that does not belong to the output of part A, and obtain the sample data W1 of the output information of part A as the basis of data statistics.

Embodiment 3

[0081] On the basis of embodiment 2, in conjunction with the attached figure 1 As shown, the step S200 specifically includes:

[0082] Step S210: Calculate the total output of each year according to the sample data W1;

[0083] Step S220: Calculate the total output of each month according to the sample data W1;

[0084] Step S230: Classify the data of each month in the sample data W1 by weekdays, weekends, and holidays, and calculate the total output on weekdays, weekends, and holidays, respectively, and count the total number of working days in the sample , the total number of weekend days and the total number of holiday days.

[0085] working principle:

[0086] Filter the data in the sample data W1 with different fields to obtain a new relational table, realize data statistics by year, month, and day, and continue to refine the statistics by day into three types: weekdays, weekends, and holidays. Counting the total output and days of different types separately and calcu...


PUM


Abstract

The invention discloses a production forecasting method. The production forecasting method includes the steps of filtering out sample data; respectively counting output data of the sample data by year, month and day; calculating annual weighted output B and monthly average weighted output T0, wherein T0 is equal to B/12; calculating monthly average weighted output T1 and respectively counting average working day output, average daily output over the weekend and average daily output over holidays; calculating correction factor K, wherein K is equal to T0/T1; Summing up and calculating monthly forecast total output P; comparing the monthly forecast total output P with real production volume to conduct production control. The production forecasting method has the advantages that with the realproduction volume compared with the forecast value by day, month and accumulative value, whether the current day, the current month output and the cumulative output are up to the standard is respectively judged, so that timely corrective measures can be made to correct deviations from expectations in a timely manner and avoid enlargement of deviations; through comparison of correction coefficientK and 1, whether this year's mission target Y0 is high or low can be obtained, so that correction is adopted to increase or reduce the daily forecast output.

Description

technical field [0001] The invention relates to the technical field of production management, in particular to a production forecasting method. Background technique [0002] In the production control center of the aviation industry, multiple processes and steps are involved in the supply chain, parts, assembly, and final assembly in production management, and the granularity of production control is refined to each part, each station, and process to achieve a full-professional , multi-element, whole-process control, providing auxiliary decision-making for production management. In the existing production management, the management of the production output is generally based on the progress management. After the analysis, it is impossible to correct the deviation between the actual production volume and the expected production volume in real time during the production process, find out the problems and countermeasures in time, and make the actual production The curve is clos...

Claims


Application Information

Patent Timeline
Patent Type & Authority Applications(China)
IPC IPC(8): G06Q10/04G06Q50/04
CPCG06Q10/04G06Q50/04Y02P90/30
Inventor 张晓军黎小华李汶一陈尚宇胡廷贵罗时杰吴渊
Owner CHENGDU AIRCRAFT INDUSTRY GROUP
Why Eureka
Try Eureka