A yield forecast method
A production forecasting and production technology, applied in forecasting, data processing applications, instruments, etc., can solve problems such as inability to correct in real time, and achieve the effect of avoiding the expansion of deviations
- Summary
- Abstract
- Description
- Claims
- Application Information
AI Technical Summary
Problems solved by technology
Method used
Image
Examples
Embodiment 1
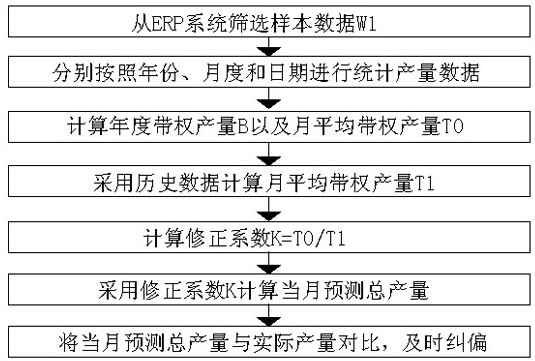
[0064] combined with figure 1 As shown, a production forecasting method, including:
[0065] Step S100: Screen out the sample data W1 from the ERP system;
[0066] Step S200: Collect the output data of the sample data W1 by year, month, and day;
[0067] Step S300: Select the output data of the past n years as the statistical sample X1, calculate the annual weighted output B and the monthly average weighted output T0, T0=B / 12;
[0068] Step S400: Select the production data of the past m months as the statistical sample X2, calculate the monthly average weighted production T1, and count the average daily production Weekday_avg on weekdays, Weekend_avg on weekends, and Holiday_avg on holidays;
[0069] Step S500: Calculating the correction coefficient K, K=T0 / T1;
[0070] Step S600: Summing up and calculating the forecasted total output P of the current month;
[0071] Step S700: Comparing the forecasted total output value P of the current month with the actual production vo...
Embodiment 2
[0075] On the basis of Example 1, in conjunction with the attached figure 1 As shown, the step S100 specifically includes:
[0076] Step S110: call the processing data of part A from the ERP system, use the part name, delivery order and receiving time as keywords to filter, and filter out the data whose receiving time is not empty;
[0077] Step S120: Further filter the data by the drawing number of the handover order to obtain the sample data W1 of part A.
[0078] working principle:
[0079] Select a class of parts from the ERP system, such as part A, as a reference, and use the same method to predict the output of other parts and components. Filter out the data whose receiving time of part A is empty, and discharge the data that does not belong to the output of part A, and obtain the sample data W1 of the output information of part A as the basis of data statistics.
Embodiment 3
[0081] On the basis of embodiment 2, in conjunction with the attached figure 1 As shown, the step S200 specifically includes:
[0082] Step S210: Calculate the total output of each year according to the sample data W1;
[0083] Step S220: Calculate the total output of each month according to the sample data W1;
[0084] Step S230: Classify the data of each month in the sample data W1 by weekdays, weekends, and holidays, and calculate the total output on weekdays, weekends, and holidays, respectively, and count the total number of working days in the sample , the total number of weekend days and the total number of holiday days.
[0085] working principle:
[0086] Filter the data in the sample data W1 with different fields to obtain a new relational table, realize data statistics by year, month, and day, and continue to refine the statistics by day into three types: weekdays, weekends, and holidays. Counting the total output and days of different types separately and calcu...
PUM
 Abstract
Description
Claims
Application Information
 - R&D
- Intellectual Property
- Life Sciences
- Materials
- Tech Scout
- Unparalleled Data Quality
- Higher Quality Content
- 60% Fewer Hallucinations
Browse by: Latest US Patents, China's latest patents, Technical Efficacy Thesaurus, Application Domain, Technology Topic, Popular Technical Reports.
© 2025 PatSnap. All rights reserved.Legal|Privacy policy|Modern Slavery Act Transparency Statement|Sitemap|About US| Contact US: help@patsnap.com

