Tightly-coupled synchronized selection, filtering, and sorting between log tables and log charts

a synchronized selection and log chart technology, applied in the field of event detection and monitoring system, can solve the problem that the visual clustering of events around certain time periods easily shows repetitive problems, and achieve the effect of tight coupling and maximizing the information available to the user

Inactive Publication Date: 2005-08-11
IBM CORP
View PDF8 Cites 26 Cited by
  • Summary
  • Abstract
  • Description
  • Claims
  • Application Information

AI Technical Summary

Benefits of technology

[0007] The present invention overcomes the individual limitations of a tabular and a graphical presentation format (such as log tables and log charts) by providing a tightly coupled two-way connection between common events depicted on both of them. An event selected from the event log file is shared between the log table and the log chart. A table and chart each carry different information of the same event, and each appeals to different mental processes. For example, a graphical presentation makes patterns of faults more obvious than a columnar series of text entries (depending upon the nature of the pattern and the graph). Based on which display of an event piques a user's interest, an event from that display may be selected and the corresponding event in the other display is automatically highlighted or otherwise visually offset, according to the present invention, for maximizing the information available to the user for that event. The selection can be a single event or multiple events being selected from the table, from the chart, or via the filter from the log file that populates the table and chart. The tight coupling between log tables and log charts is also beneficial when combined with conventional sorting and filtering of the event log table.
[0008] The graphical views make user log interactions more valuable than viewing only event log tables. For example, the visual clustering of events around certain time periods readily shows repetitive problems. Such event clustering is more difficult to see in a tabular log thereby making tight coupling of log tables and log charts more valuable to users and administrators.

Problems solved by technology

For example, the visual clustering of events around certain time periods readily shows repetitive problems.

Method used


Image

  • Tightly-coupled synchronized selection, filtering, and sorting between log tables and log charts
  • Tightly-coupled synchronized selection, filtering, and sorting between log tables and log charts
  • Tightly-coupled synchronized selection, filtering, and sorting between log tables and log charts

Examples


Embodiment Construction

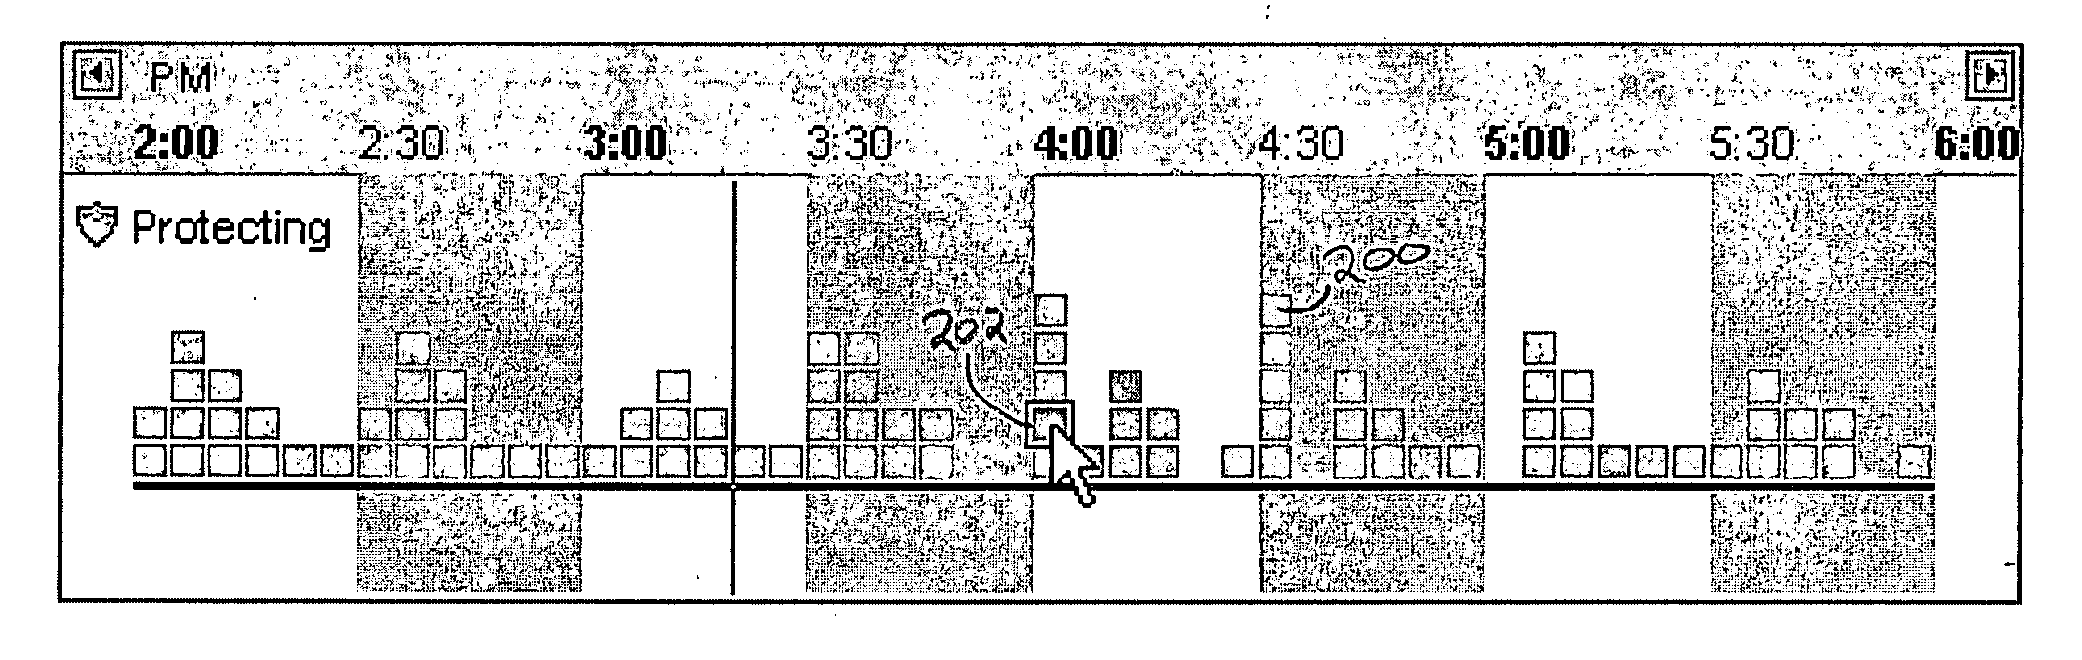
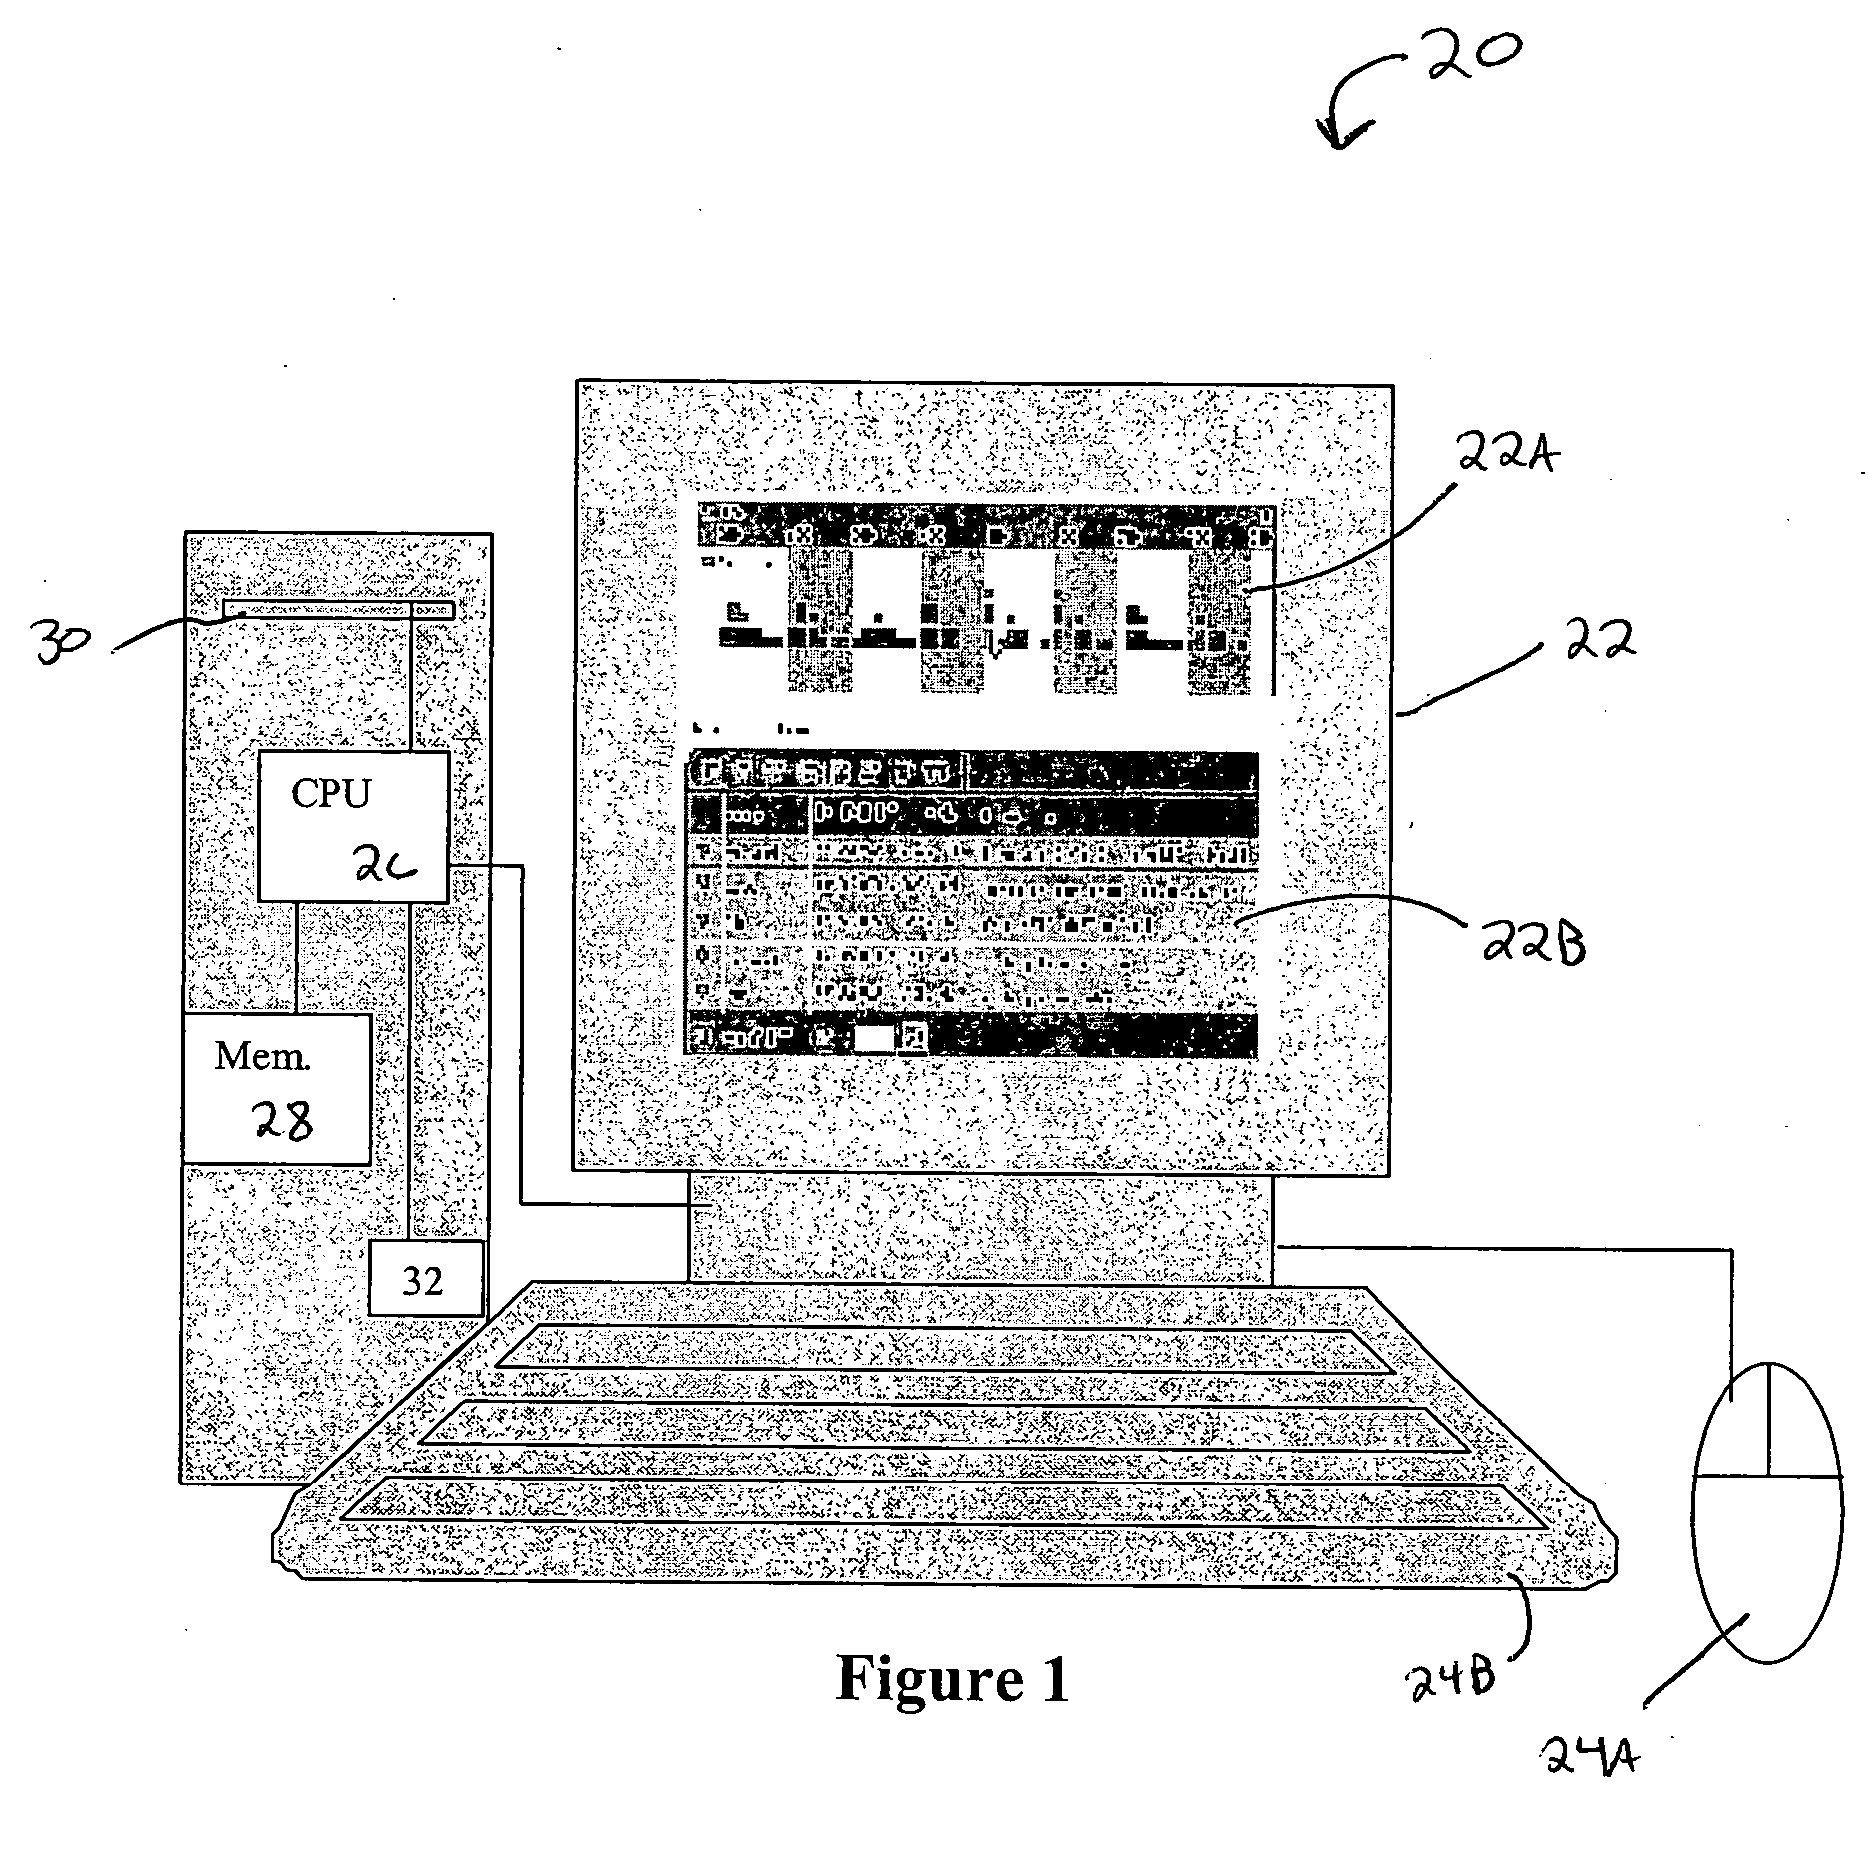
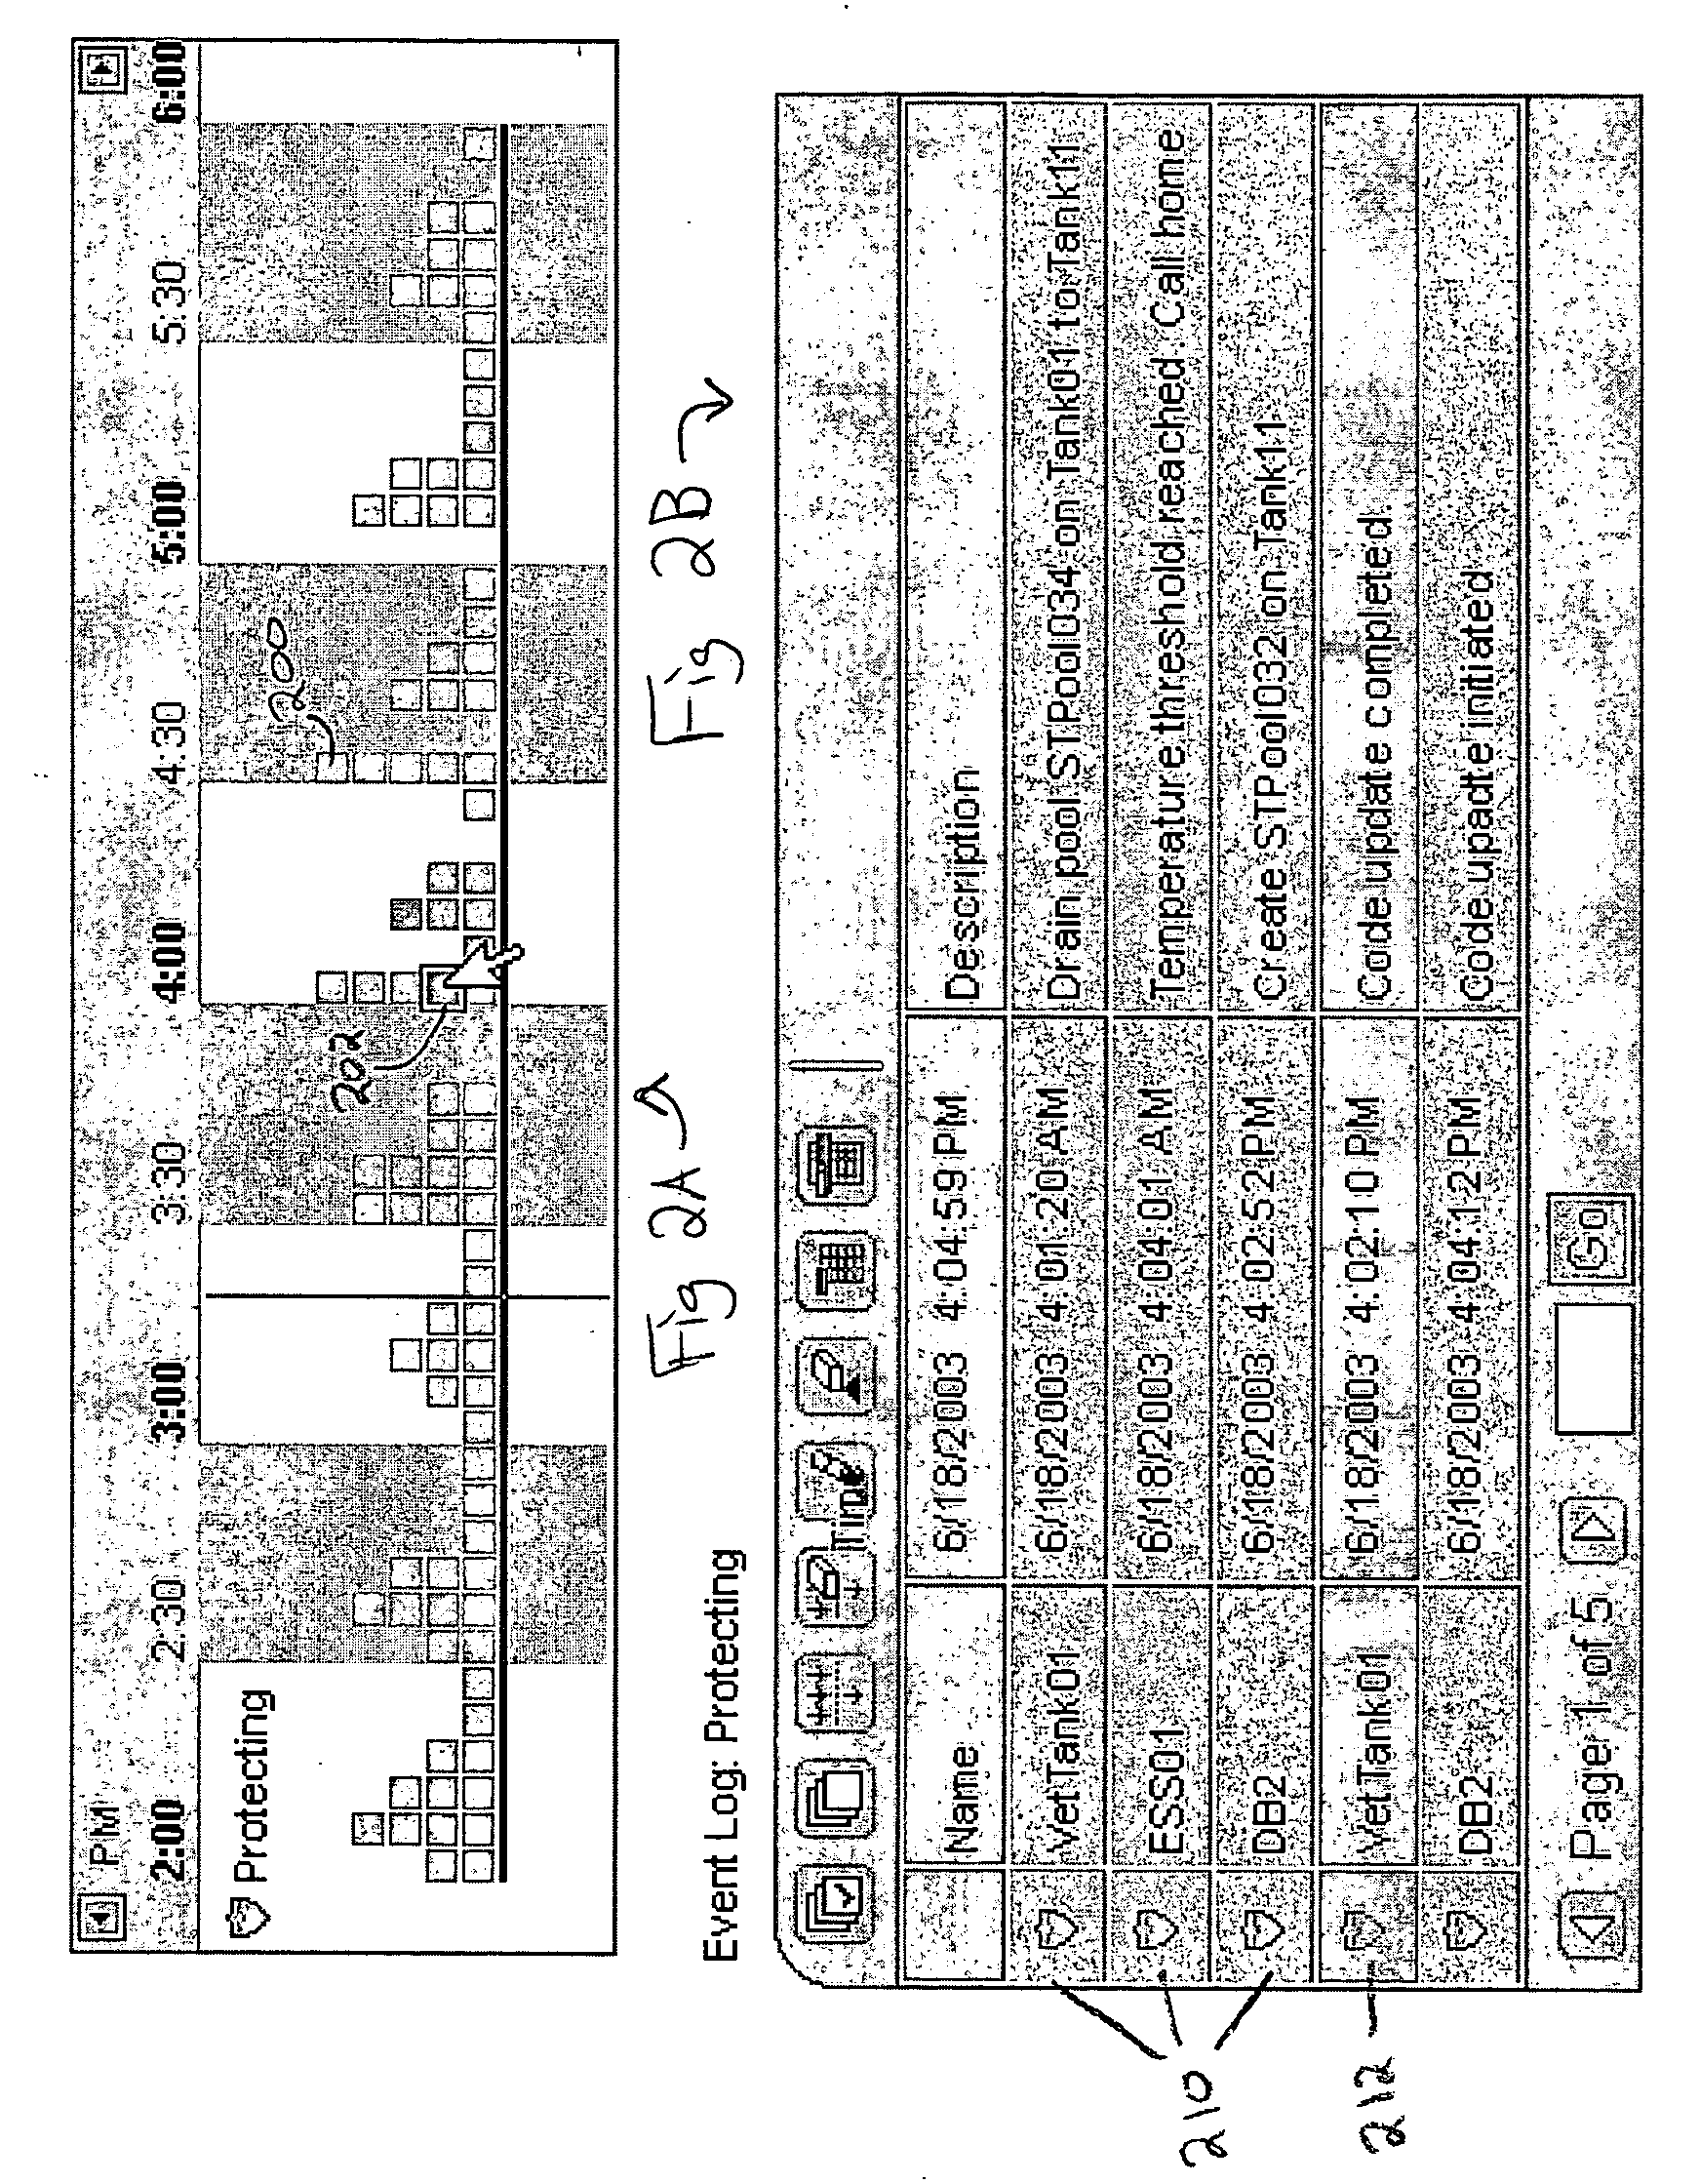
[0025] The present invention is most advantageously implemented by a computer, and is therefore preferably a computer program (e.g., a set of computer instructions) embodied on a computer readable medium such as a PC or server hard drive, a magnetic tape or disk, an optical disk, an electronic media such as a memory stick, or the like. The computer instructions cause the computer to execute various steps to practice the invention as detailed in this disclosure and claims. One suitable computer system 20 is illustrated in FIG. 1 having a display such as a CRT or plasma screen that simultaneously displays a log chart 22A and a log table 22B, which are different representations of the same underlying data. The computer system further includes a user interface such as a mouse 24A and keyboard 24B, at least one data processor CPU 26, a memory 28, and a display driver 32. The system 20 may also include a drive 30 for reading removable computer storage media such as magnetic diskettes, opt...


PUM


Abstract

In an event detection and monitoring system displaying event data in both tabular and chart formats, the displays of each are tightly-coupled to one another so that when a user selects an event in one format the corresponding event in the other format is highlighted or otherwise emphasized. When a user selects a row containing an event of interest in the event log table, the symbol in the event log chart corresponding to the selected event is simultaneously highlighted. Similarly, when a user selects a symbol in the event log chart corresponding to an event of interest, the row in the event log table containing the corresponding event is simultaneously highlighted. In addition, the rows of the event log table can be sorted and filtered according to predetermined criteria, and the events selected by the filters are highlighted in the chart with indicia distinguishing the filter.

Description

FIELD OF THE INVENTION [0001] The present invention relates generally to an event detection and monitoring system and specifically, relates to displaying event data in both tabular and chart formats. The tabular and chart format data are tightly-coupled so that when a user selects an event in one format, the corresponding event in the other format is highlighted. BACKGROUND OF THE INVENTION [0002] An event detection and monitoring system detects the occurrence of a system event and creates a record of the event. Event log files are created by many different programs to record different types of events for later analysis, and can be sorted and ordered by categories such as time, date, event type, and the like. While log files in tabular format do provide a wealth of information about individual events in isolation, they do not readily illuminate patterns or clusters of events that in the aggregate may help to isolate or narrow a problem that may be causing the events being reported. ...

Claims


Application Information

Patent Timeline
Patent Type & Authority Applications(United States)
IPC IPC(8): G06F3/00G06F3/048
CPCG06F2203/04803G06F3/0482
Inventor MOLANDER, MARK E.KLUTTZ, KAREN RUTHBERTRAM, RANDAL LEJOHNSON, DAVID PHILLIP
Owner IBM CORP
Why Eureka
Try Eureka