Data capacity visualization method and system and computer readable storage medium

A technology of data capacity and time series data, applied in other database browsing/visualization, computing, other database retrieval and other directions, can solve problems such as unclear results, uncertain requirements and targets, etc.

Pending Publication Date: 2022-05-13
江苏明月软件技术股份有限公司
View PDF3 Cites 0 Cited by
  • Summary
  • Abstract
  • Description
  • Claims
  • Application Information

AI Technical Summary

Problems solved by technology

[0009] The defect of the existing technology is that the process of data mining is dominated by humans, and analysts are required to screen and analyze sensitive indicator data in their respective system domains. All correlation analysis between specific indicators is limited to a specific domain, and the demand target is uncertain. , it is not clear what can be achieved

Method used


Image

  • Data capacity visualization method and system and computer readable storage medium
  • Data capacity visualization method and system and computer readable storage medium
  • Data capacity visualization method and system and computer readable storage medium

Examples


Embodiment 2

[0162] The following examples are mainly based on the customer service transaction system (CCS-B),

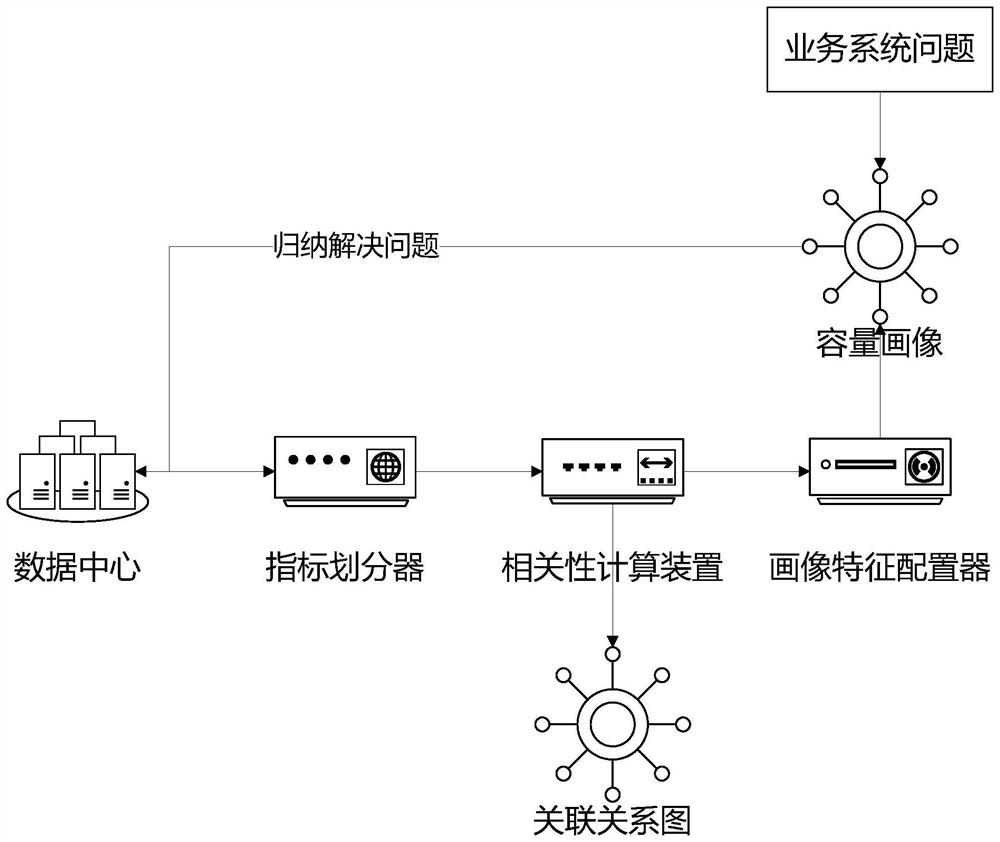
[0163] In the data center, a large number of indicators of the CCS-B system are monitored, extracted and managed. After the extraction is completed, all indicators are passed to the indicator divider in units of systems;

[0164] In the indicator divider, all indicators under the CCS-B system are first divided according to the domain, mainly divided into four parts: application domain {A}, system domain {B}, storage domain {C}, and database domain {D};

[0165] For these four sets, the application domain belongs to the special business-triggered domain, while the other three domains belong to the business-affected domain;

[0166] Therefore, based on this judgment, subsequent calculations and relationship diagrams are placed between the application domain and other domains;

[0167] After the index divider divides the index into various fields, it accurately locates each index...


PUM


Abstract

The invention discloses a data capacity visualization method and system and a computer readable storage medium, a data center is a data storage center, and an index divider performs field division on indexes according to different belongings of the indexes; the correlation calculation device calculates a correlation coefficient between every two indexes in a maximum information coefficient mode while completing index preparation; the portrait feature configurator calculates corresponding risk indexes for the indexes in all statistical ranges according to a risk assessment method, calculates risk indexes of corresponding fields and systems according to the risk indexes of the indexes, and further provides a data basis for capacity portraits; and after correlation calculation among all or specified important indexes is completed, the correlation degree among the indexes in the field under one system can be displayed in an image mode. According to the data capacity visualization method, on the basis of indexes of a data center, correlation calculation is carried out after division according to fields, and then a capacity portrait based on a relational graph is obtained after portrait feature configuration is completed.

Description

technical field [0001] The invention relates to a data capacity processing method, in particular to a data capacity visualization method, system and computer-readable storage medium. Background technique [0002] With the rapid development of banking and financial services on the Internet, business systems that meet various needs of different customers are constantly emerging and iterating. The sharp increase in business volume and types inevitably makes it more difficult for multiple systems to be managed by banks as a whole. In order to meet the bank's overall management of the management system, a large number of different types of indicators need to be collected and stored, related relationship mining, predictive analysis, alarm prevention and other behaviors. [0003] Capacity management, as it arises, is meant to focus on providing the required capacity for data processing and storage at the right time and in an economical way. However, as a system, the existing tech...

Claims


Application Information

Patent Timeline
Patent Type & Authority Applications(China)
IPC IPC(8): G06F16/904G06F11/30
CPCG06F16/904G06F11/3065
Inventor 姜帅潘宇翁云潞王鸿一
Owner 江苏明月软件技术股份有限公司
Why Eureka
Try Eureka