
Electromigration testing and evaluation apparatus and methods
a technology of electromigration and testing method, applied in the direction of resistance/reactance/impedence, instruments, and semiconductor/solid-state device details, can solve the problems of integrated circuit failure, voids in interconnect structure nucleation and growth, etc., to reduce the cost of testing and evaluation, short testing time, and short testing time
- Summary
- Abstract
- Description
- Claims
- Application Information
AI Technical Summary
Benefits of technology
Problems solved by technology
Method used
Image

Examples
Embodiment Construction
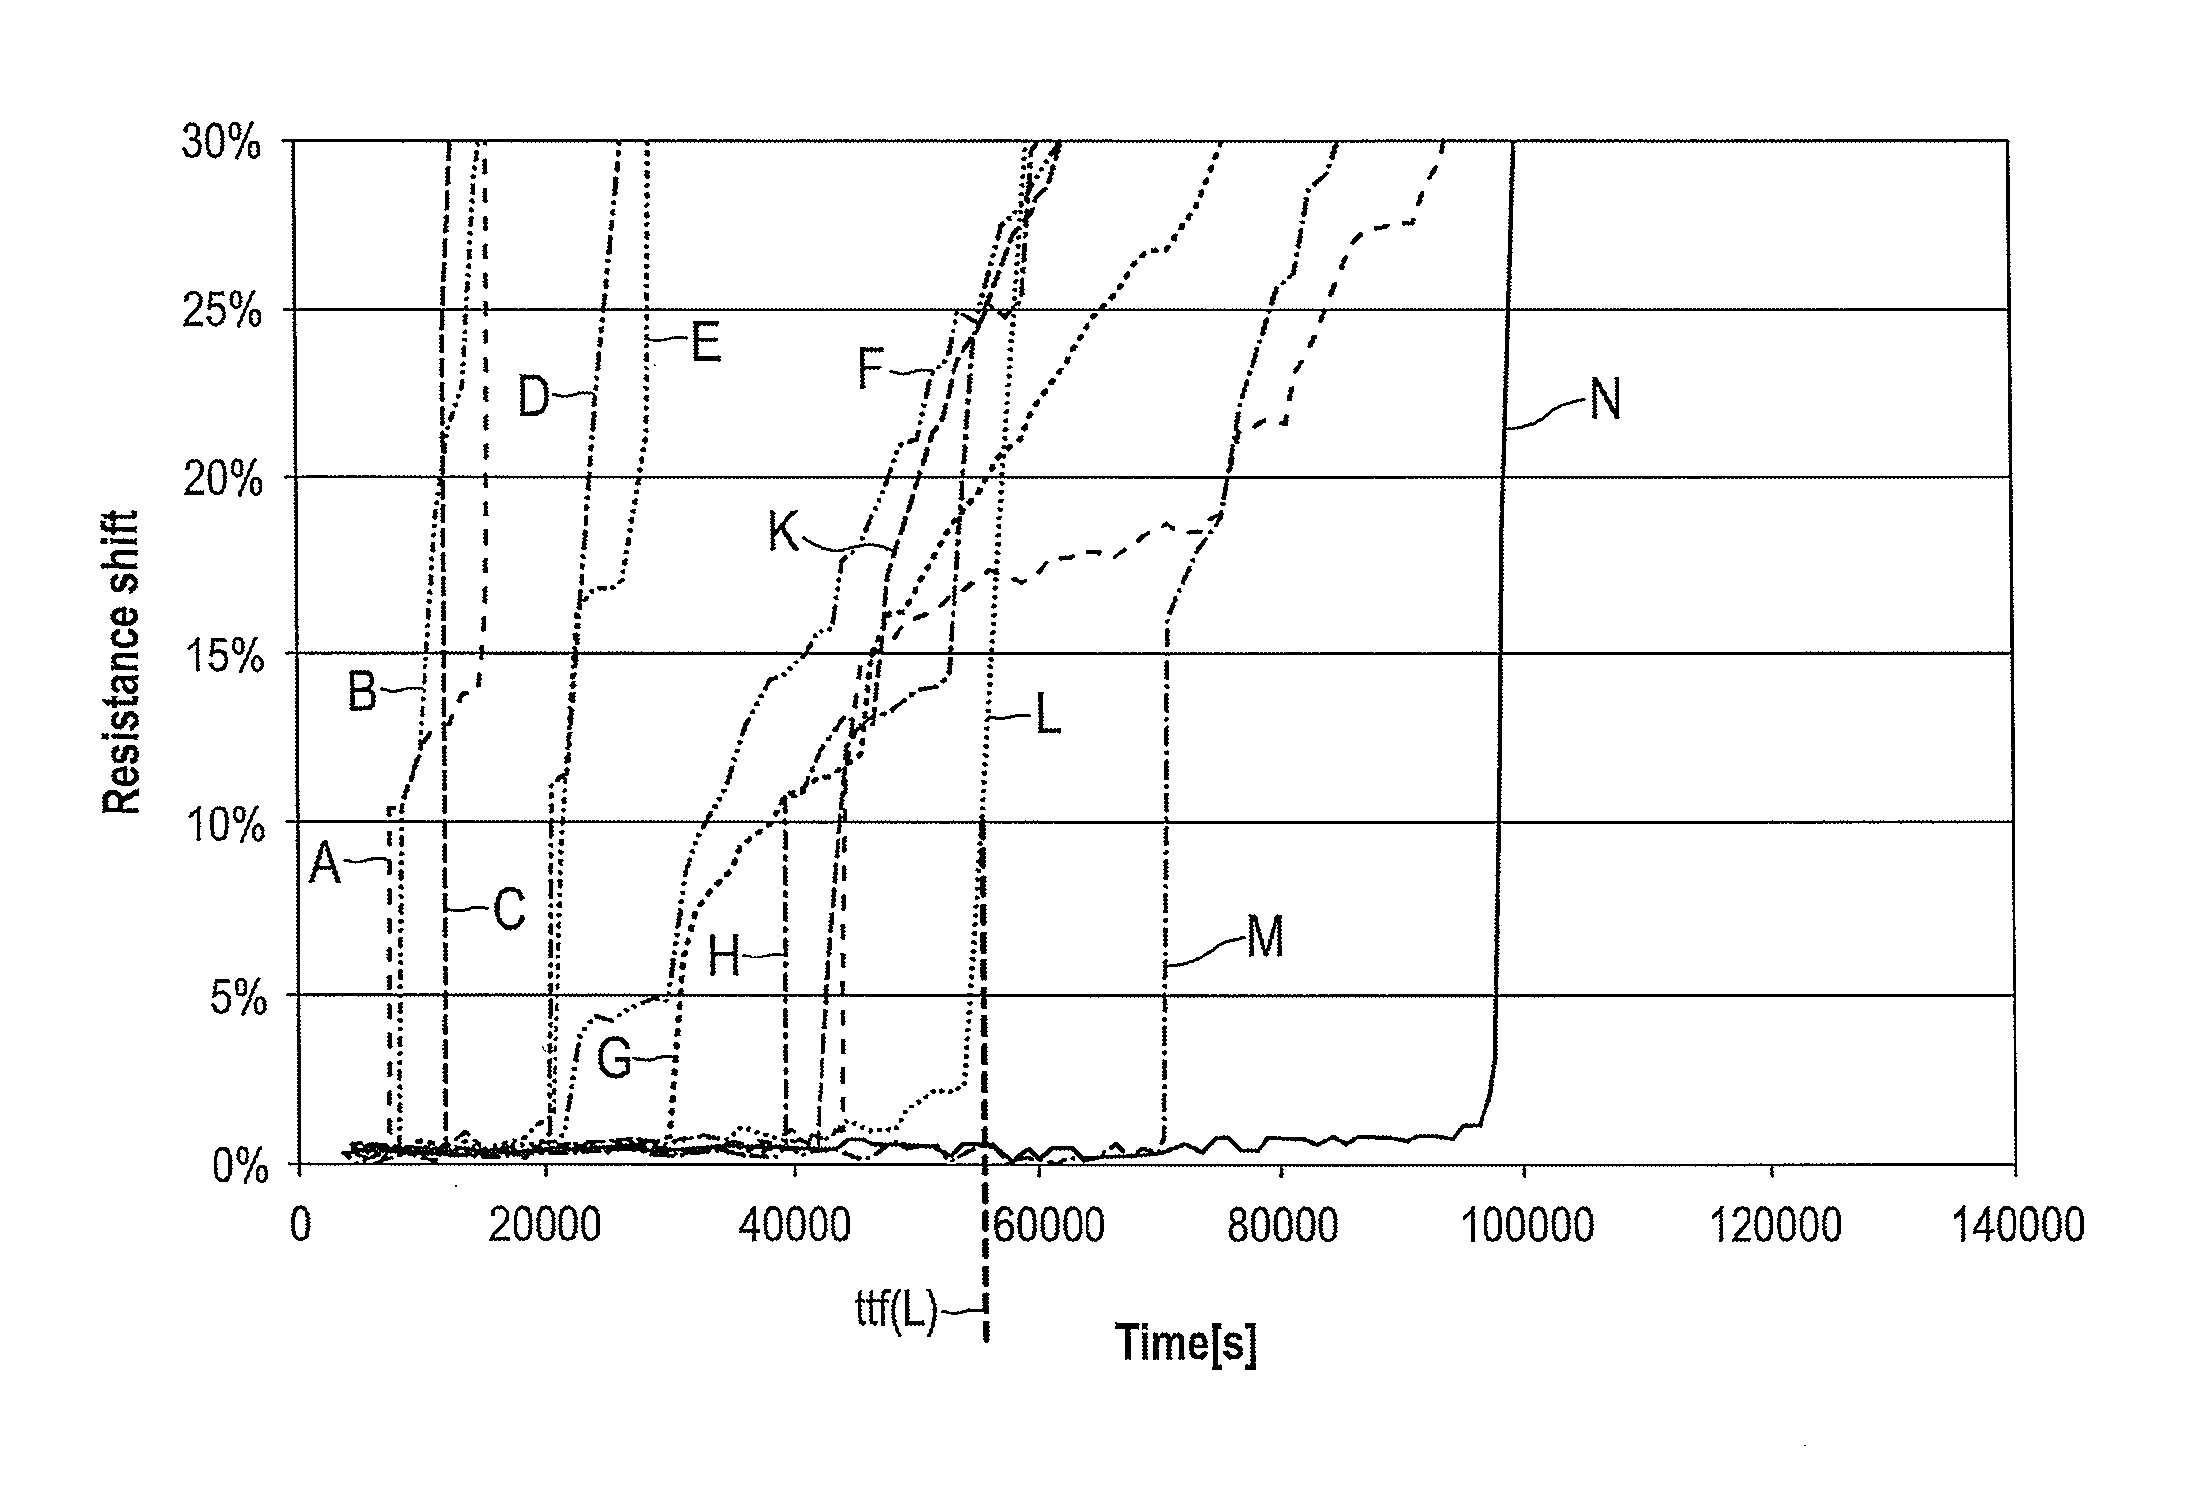
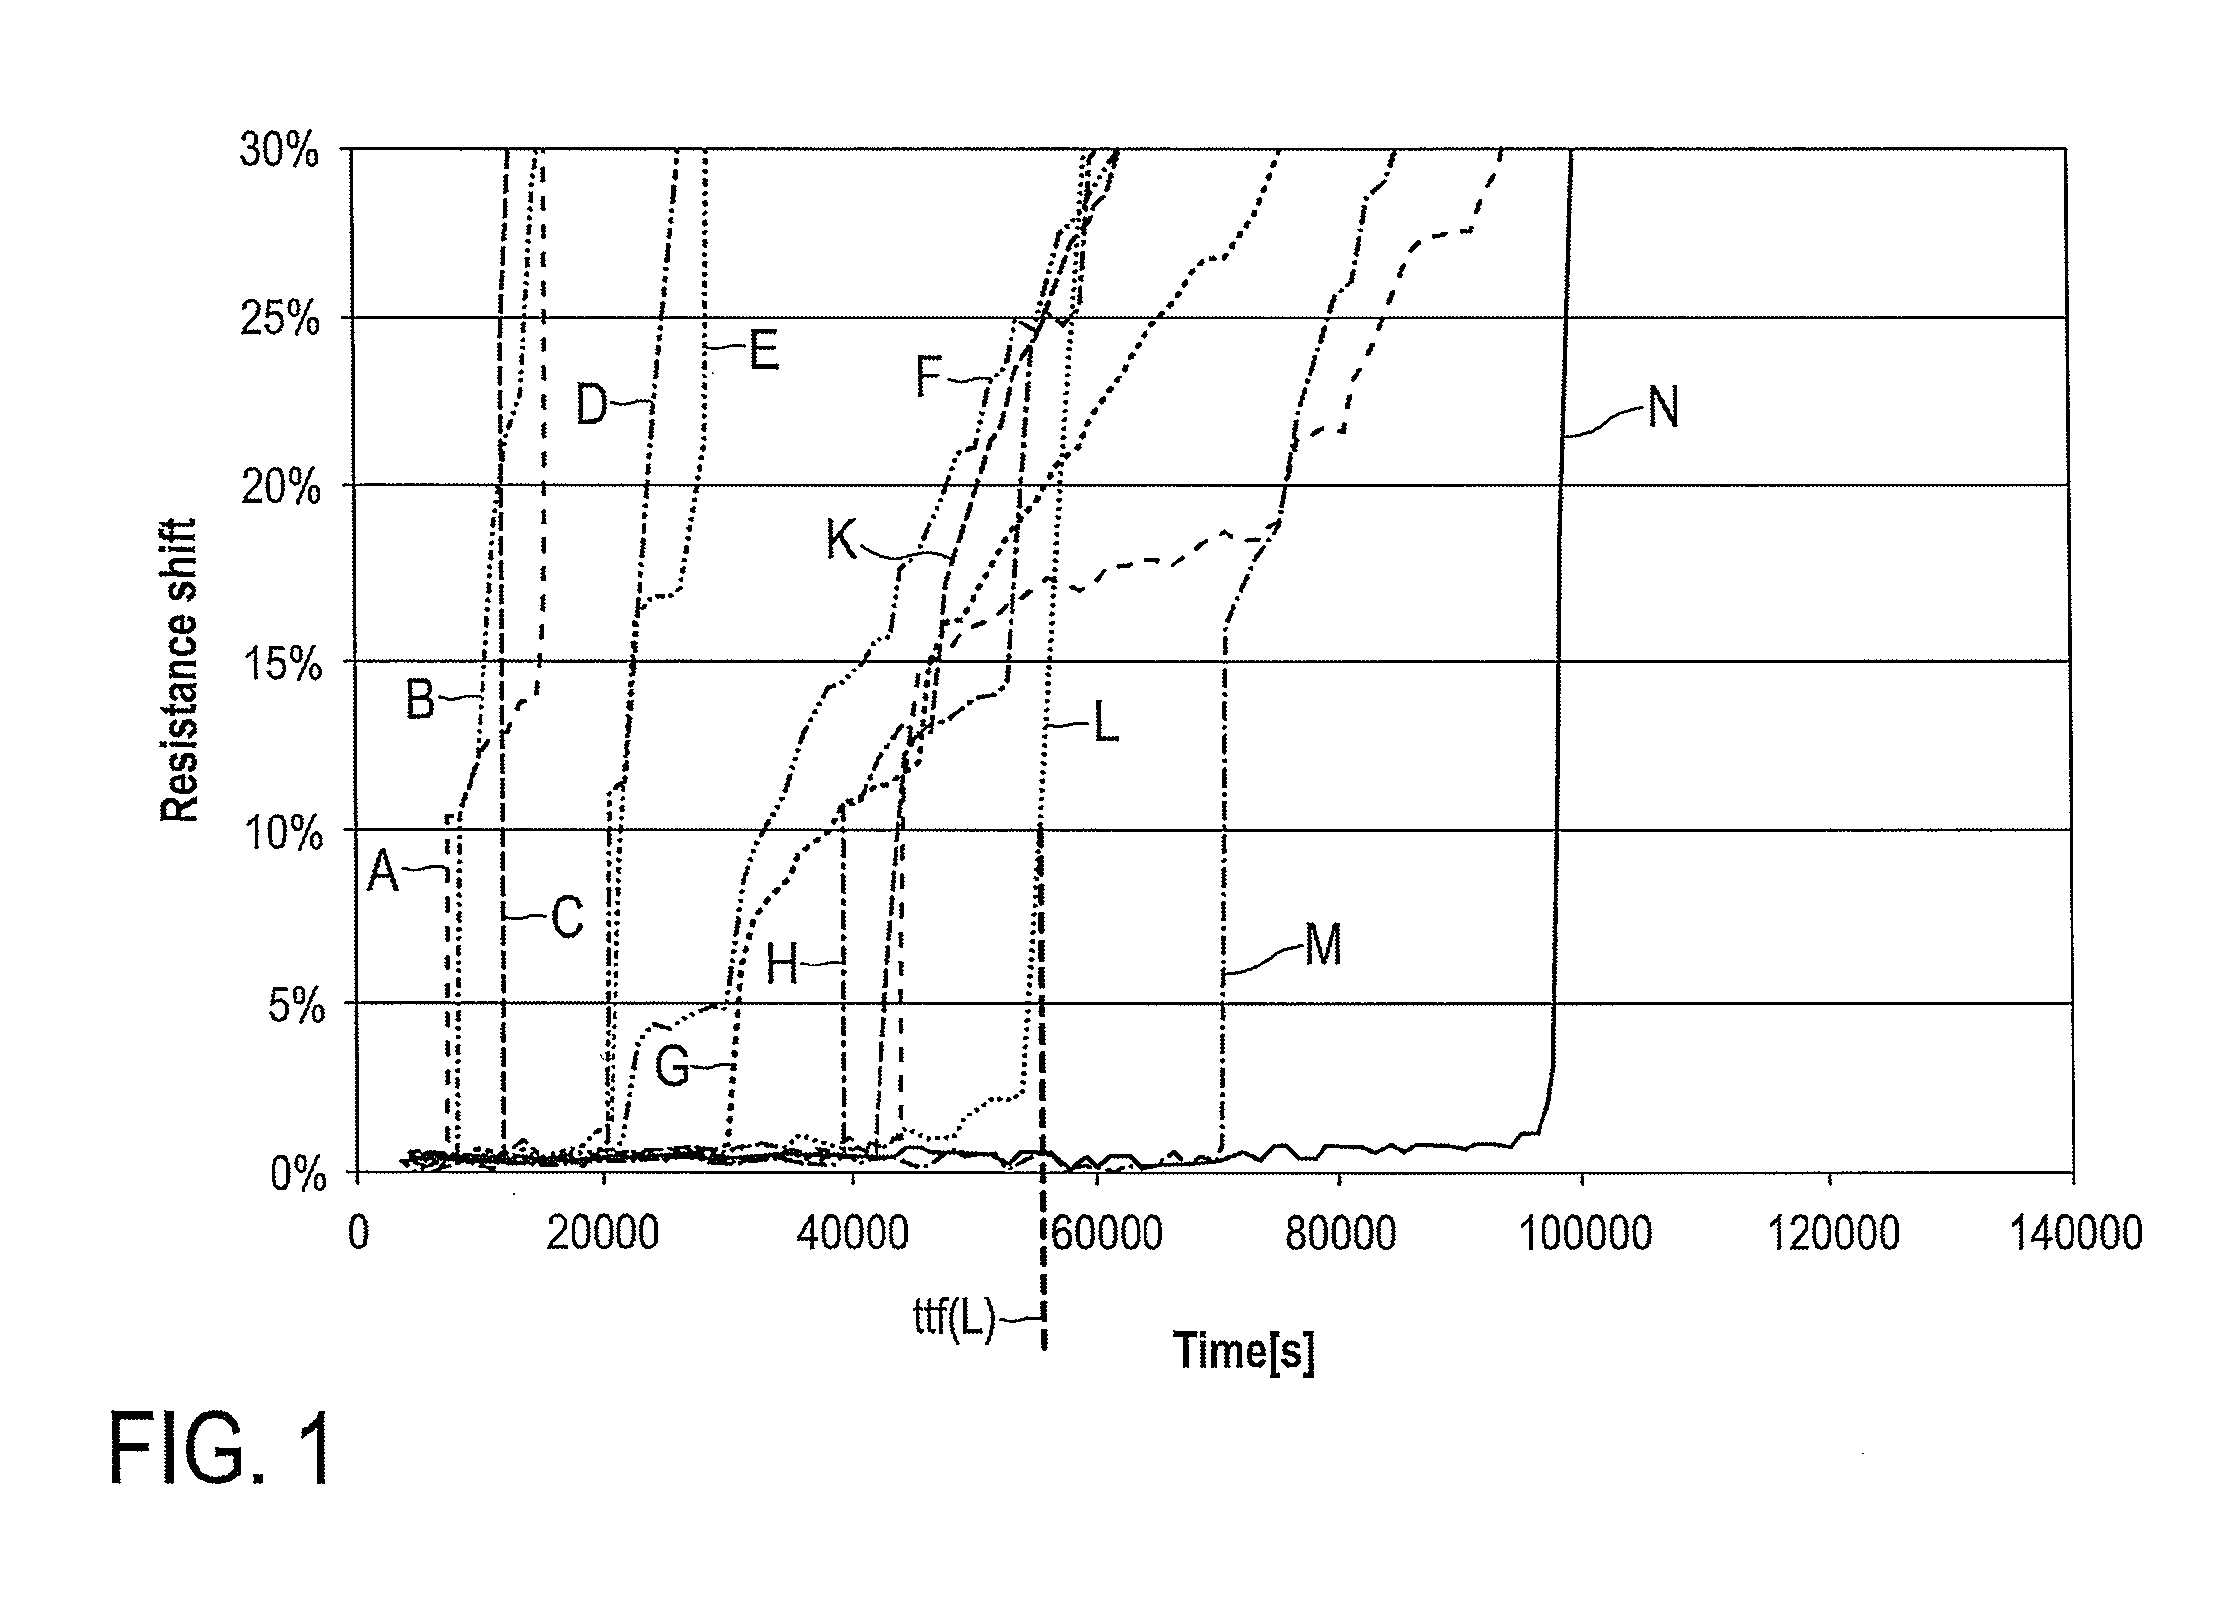
[0098]FIG. 1 shows a diagram illustrating the evolution of the electrical resistance of an interconnect structure in time under exemplary stress conditions for a number of nominally identical samples taken from a specific wafer lot.
[0099]The resistance change is plotted on the y-axis in relative units between 0 and 30%. On the x-axis, the time is plotted in units of seconds.
[0100]For the resistance measurements, which are shown in FIG. 1, the samples were all subjected to stress conditions formed by a temperature of 300° C. and a current density of 1.5 MA / cm2 in the interconnect structure. Each resistance trace plotted in the diagram of FIG. 1 corresponds to one sample.
[0101]It is clearly visible from FIG. 1 that the different samples exhibit quite different time-to-failure (TTF) values. The TTF refers to the time span from the beginning of the measurement to reaching a step resistance increase. Some samples exhibit a TTF value, which is lower than 10 000 seconds. Exemplary resistan...
PUM
 Abstract
Description
Claims
Application Information