
Method and device and system for realizing display of key performance indexes
A technology of key performance indicators and implementation methods, applied in the field of communication, can solve problems such as single display mode and inability to meet the individual needs of users, and achieve the effect of flexible customization
- Summary
- Abstract
- Description
- Claims
- Application Information
AI Technical Summary
Problems solved by technology
Method used
Image

Examples
example 1
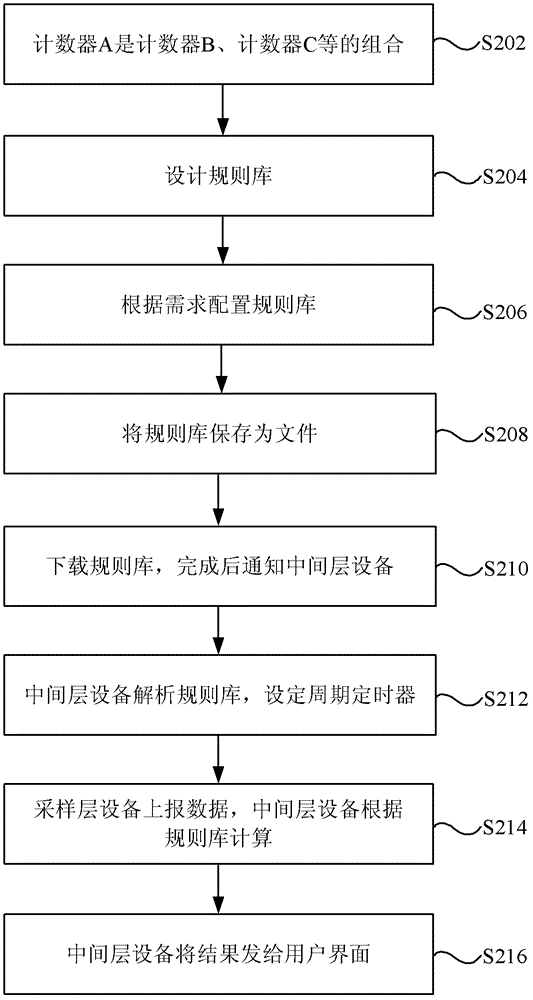
[0043] figure 2 It is a flow chart of a method for displaying key performance indicators according to Example 1 of the present invention. Such as figure 2 As shown, the display implementation method mainly includes the following processing:
[0044]Step S202: Assume that counter A is a combination of counter B and counter C, etc., such as: the cell throughput is the packet data concentration protocol (Packet Data Convergence Protocol, referred to as PDCP), radio link control layer protocol (Radio LinkControl, referred to as RLC ), a medium access control layer (Medium Access Control, referred to as MAC), and a combination of throughput at different statistical levels of the physical layer. PDCP, RLC, MAC, and physical layers perform throughput sampling at their respective levels, and the events and structures reported by the sampling layer are shown in Table 1;
[0045] Table 1
[0046] Sampling layer event number
Sampling Layer Meaning
Number of columns...
example 2
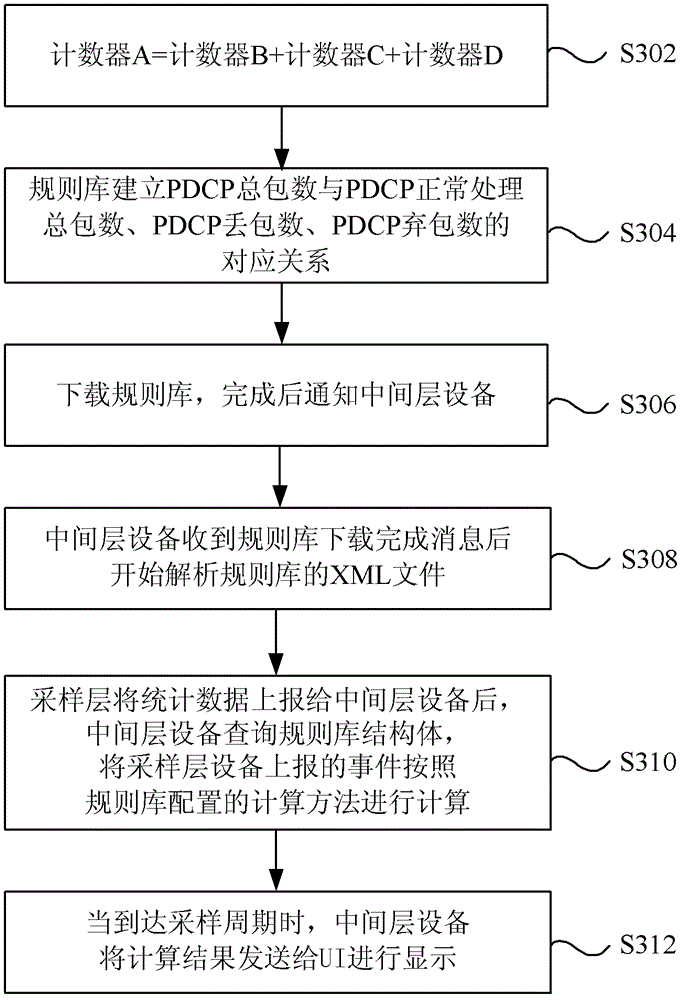
[0057] image 3 It is a flow chart of a method for realizing the display of key performance indicators according to Example 2 of the present invention. Such as image 3 As shown, the display implementation method mainly includes the following processing:
[0058] Step S302: counter A=counter B+counter C+counter D, for example, the total number of packets at the PDCP layer=the total number of normally processed packets at the PDCP layer+the number of PDCP discarded packets+the number of PDCP discarded packets. The events and structures reported by the sampling layer are shown in Table 3;
[0059] table 3
[0060] Sampling layer event number
Sampling Layer Meaning
Number of columns
Column 1 Meaning
3900
Total number of PDCP packets
1
Total number of downlink PDCP packets
3901
PDCP packet loss
1
Number of downlink PDCP packet loss
3902
PDCP discarded packets
1
Number of downlink PDCP disc...
PUM
 Abstract
Description
Claims
Application Information