AI technical title is built by PatSnap AI team. It summarizes the technical point description of the patent document.
A technology of substance content and analysis method, applied in the direction of analyzing materials, material excitation analysis, material analysis by optical means, etc., can solve the problems of inability to build models with various chemical information, large errors, etc.
Inactive Publication Date: 2019-08-06
WUHAN POLYTECHNIC UNIVERSITY
View PDF1 Cites 0 Cited by
Summary
Abstract
Description
Claims
Application Information
AI Technical Summary
This helps you quickly interpret patents by identifying the three key elements:
Problems solved by technology
Method used
Benefits of technology
Problems solved by technology
However, only using one chemical signal cannot fully reflect the characteristics of the substance, so the error of the partial least squares regression quantitative analysis model is relatively large
[0003] However, the traditional partial least squares model and its improved methods include partial least squares with variance constraints and orthogonal signal correction partial least squares, which can only be modeled for a single signal, and cannot effectively and comprehensively utilize multiple samples. chemical information modeling
Method used
Image
Click on the blue label to locate the original text in one second.
Reading with bidirectional positioning of images and text.
Examples
no. 1 example
[0061] Such as figure 1 As shown in the flow diagram of the first embodiment:
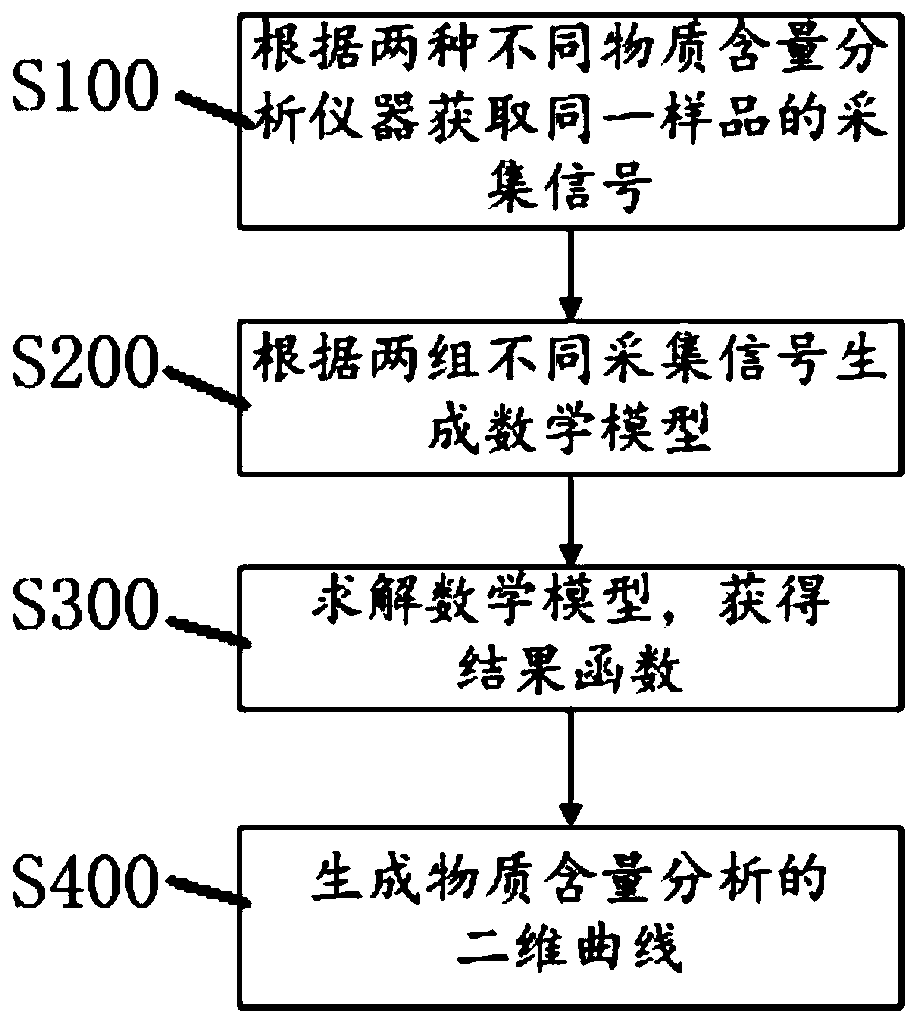
[0062] A substance content analysis method, comprising the following steps:
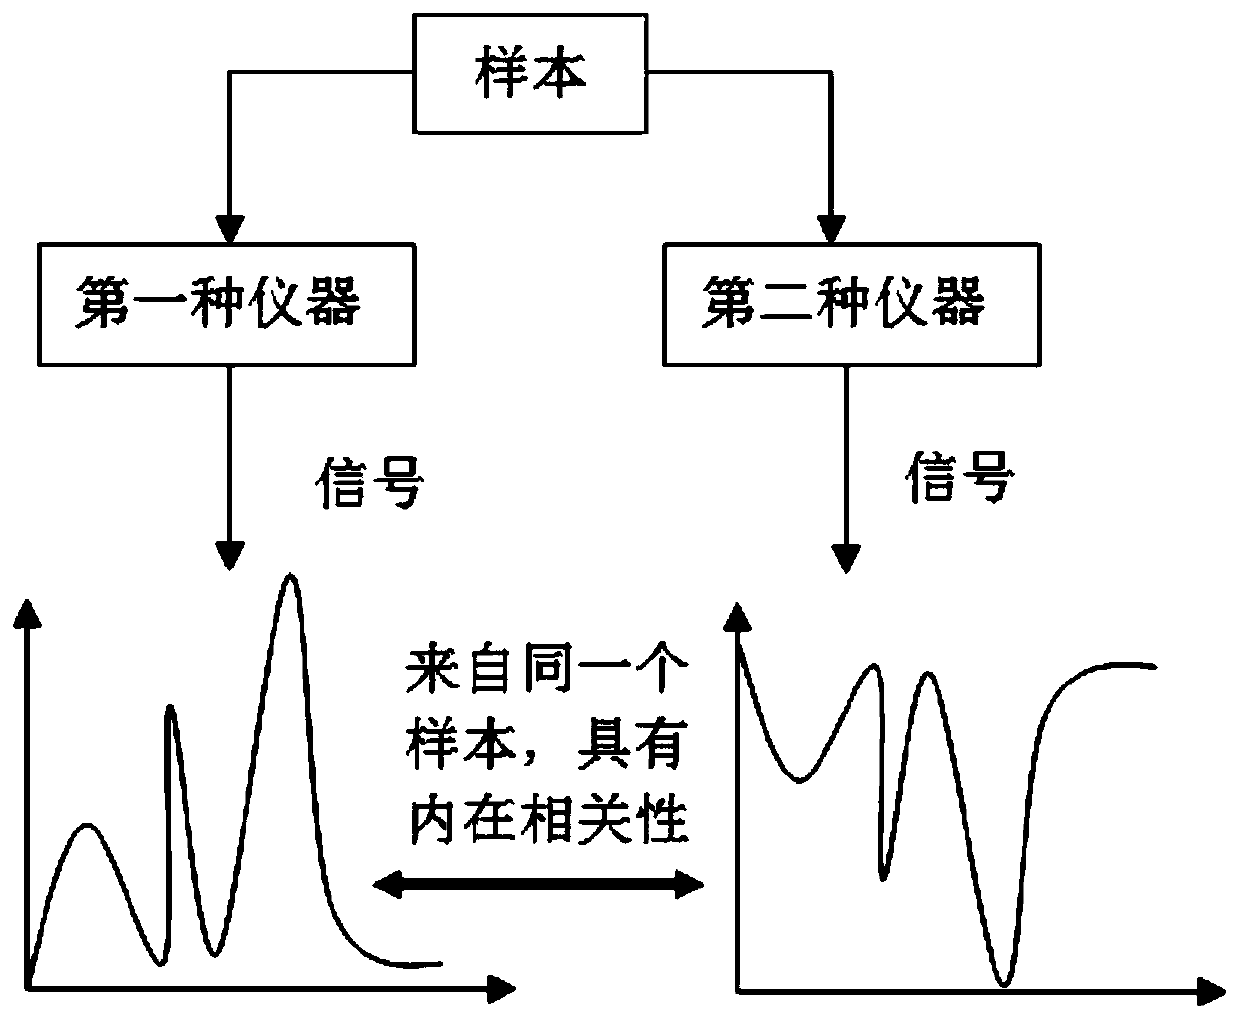
[0063] S100: Acquiring acquisition signals of the same sample according to two different substance content analysis instruments;
[0064] S200: Generate a mathematical model according to two sets of different collected signals:
[0065] arg max 1 x 1 w 1 +α 2 x 2 w 2 +λ1 w 1 , X 2 w 2 >
[0066] s.t||w 1 || 2 = 1, ||w 2 || 2 = 1,
[0067] Among them, the symbol "" represents the inner product operation, λ is the regularization constant, the symbol s.t represents the constraint condition, ||·|| 2 Indicates seeking the 2 norm;
[0068] S300: Solving the mathematical model to obtain a result function:
[0069] β=(α 1 x 1 W 1 +α 2 x 2 W 2 )+Y, where β is the regression coefficient, (.) + represents the generalized inverse.
[0070] Preferably, in the method for analyzing the content of substances, th...
no. 3 example
[0125] Based on the above analysis methods, the results of the three specific experimental analyzes and comparisons are as follows:
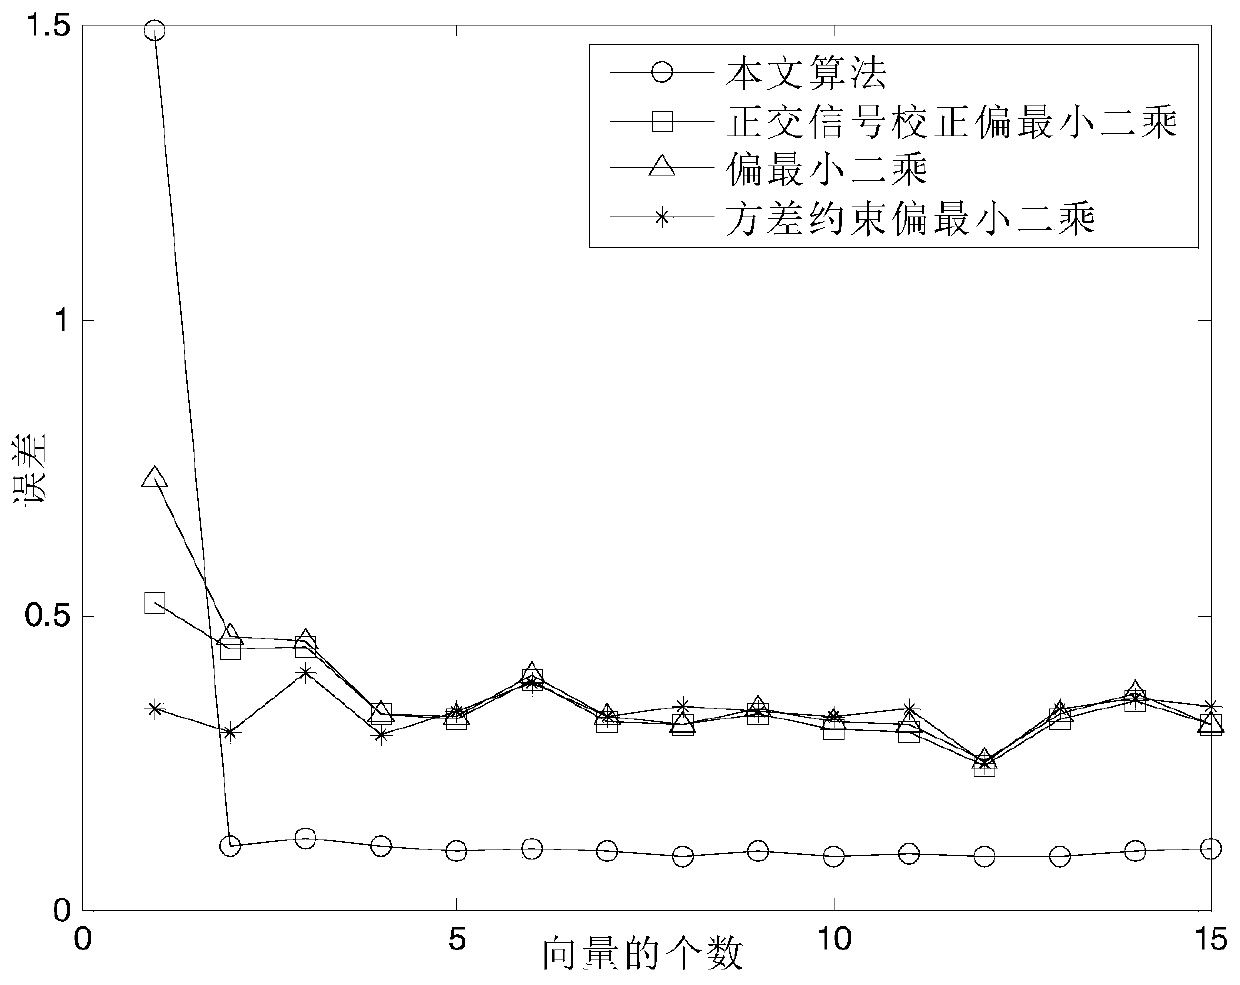
[0126]1. Spectral analysis of tablets. The data set consists of 320 near-infrared spectra and 120 Raman spectra. The analysis index is the content of active ingredients. Select 116 near-infrared spectra and Raman spectra with the same active ingredients, and set 116 The matrix composed of near-infrared spectra is X 1 , the matrix composed of 116 Raman spectra is X 2 , parameter α 1 = 0.5, α 2 =100,λ 1 = 10, gamma 1 = 100, gamma 2 =150,
[0127] k=20, h=15 compare the errors of this method and the other three methods such as image 3 It is shown in the schematic diagram of the analysis results of the active substance content of the tablet according to the third embodiment of the present invention, from image 3 It can be seen that the error of the specific algorithm scheme provided in this paper is the smallest.
[0128] 2. Spectral anal...
PUM
Abstract
The invention provides a matter content analysis method, and relates to the technical field of quantitative analysis method of matter composition and content, and specifically a method of establishing a quantitative analysis model by use of multiple chemical signals in a sample to perform the analysis. The invention discloses a matter content analysis method, and comprises the following steps: S100, acquiring signals of the same sample according to two different matter content analyzers; S200, generating a mathematic model as shown in description according to two groups of different acquiring signals, wherein the symbol <.> represents the inner product operation, the lambda is regularization constant; alpha1 and alpha2 are linear combination coefficient, the symbol s.t represents a constraint condition, formula as shown in description represents the 2 normal; S300: solving the mathematic model to acquire a result function: beta=(alpha1X1W1+alpha2X2W2)+Y, wherein the beta is regression coefficient, and (.)<+> represents generalized inverse.
Description
technical field [0001] The present invention relates to the technical field of quantitative analysis methods for material composition and content, in particular to a method for establishing a quantitative analysis model by using various chemical signals in a sample for analysis. Background technique [0002] Quantitative analysis of substances is an important means to study the properties of substances. Usually, the partial least squares regression quantitative analysis model is established by using chromatogram or spectrum alone. However, only using one chemical signal cannot fully reflect the characteristics of the substance, so the error of the partial least squares regression quantitative analysis model is relatively large. [0003] However, the traditional partial least squares model and its improved methods include partial least squares with variance constraints and orthogonal signal correction partial least squares, which can only be modeled for a single signal, and ...
Claims
Application Information
Patent Timeline
Application Date:The date an application was filed.
Publication Date:The date a patent or application was officially published.
First Publication Date:The earliest publication date of a patent with the same application number.
Issue Date:Publication date of the patent grant document.
PCT Entry Date:The Entry date of PCT National Phase.
Estimated Expiry Date:The statutory expiry date of a patent right according to the Patent Law, and it is the longest term of protection that the patent right can achieve without the termination of the patent right due to other reasons(Term extension factor has been taken into account ).
Invalid Date:Actual expiry date is based on effective date or publication date of legal transaction data of invalid patent.

