

Apparatus for automatically diagnosing emphysema
a technology of automatic diagnosis and emphysema, applied in the field of automatic diagnosis of emphysema, can solve the problems of not being suitable for accurate differentiation of emphysema from copd, and not accurately distinguishing airway obstruction
- Summary
- Abstract
- Description
- Claims
- Application Information
AI Technical Summary
Benefits of technology
Problems solved by technology
Method used
Image

Examples
example 1
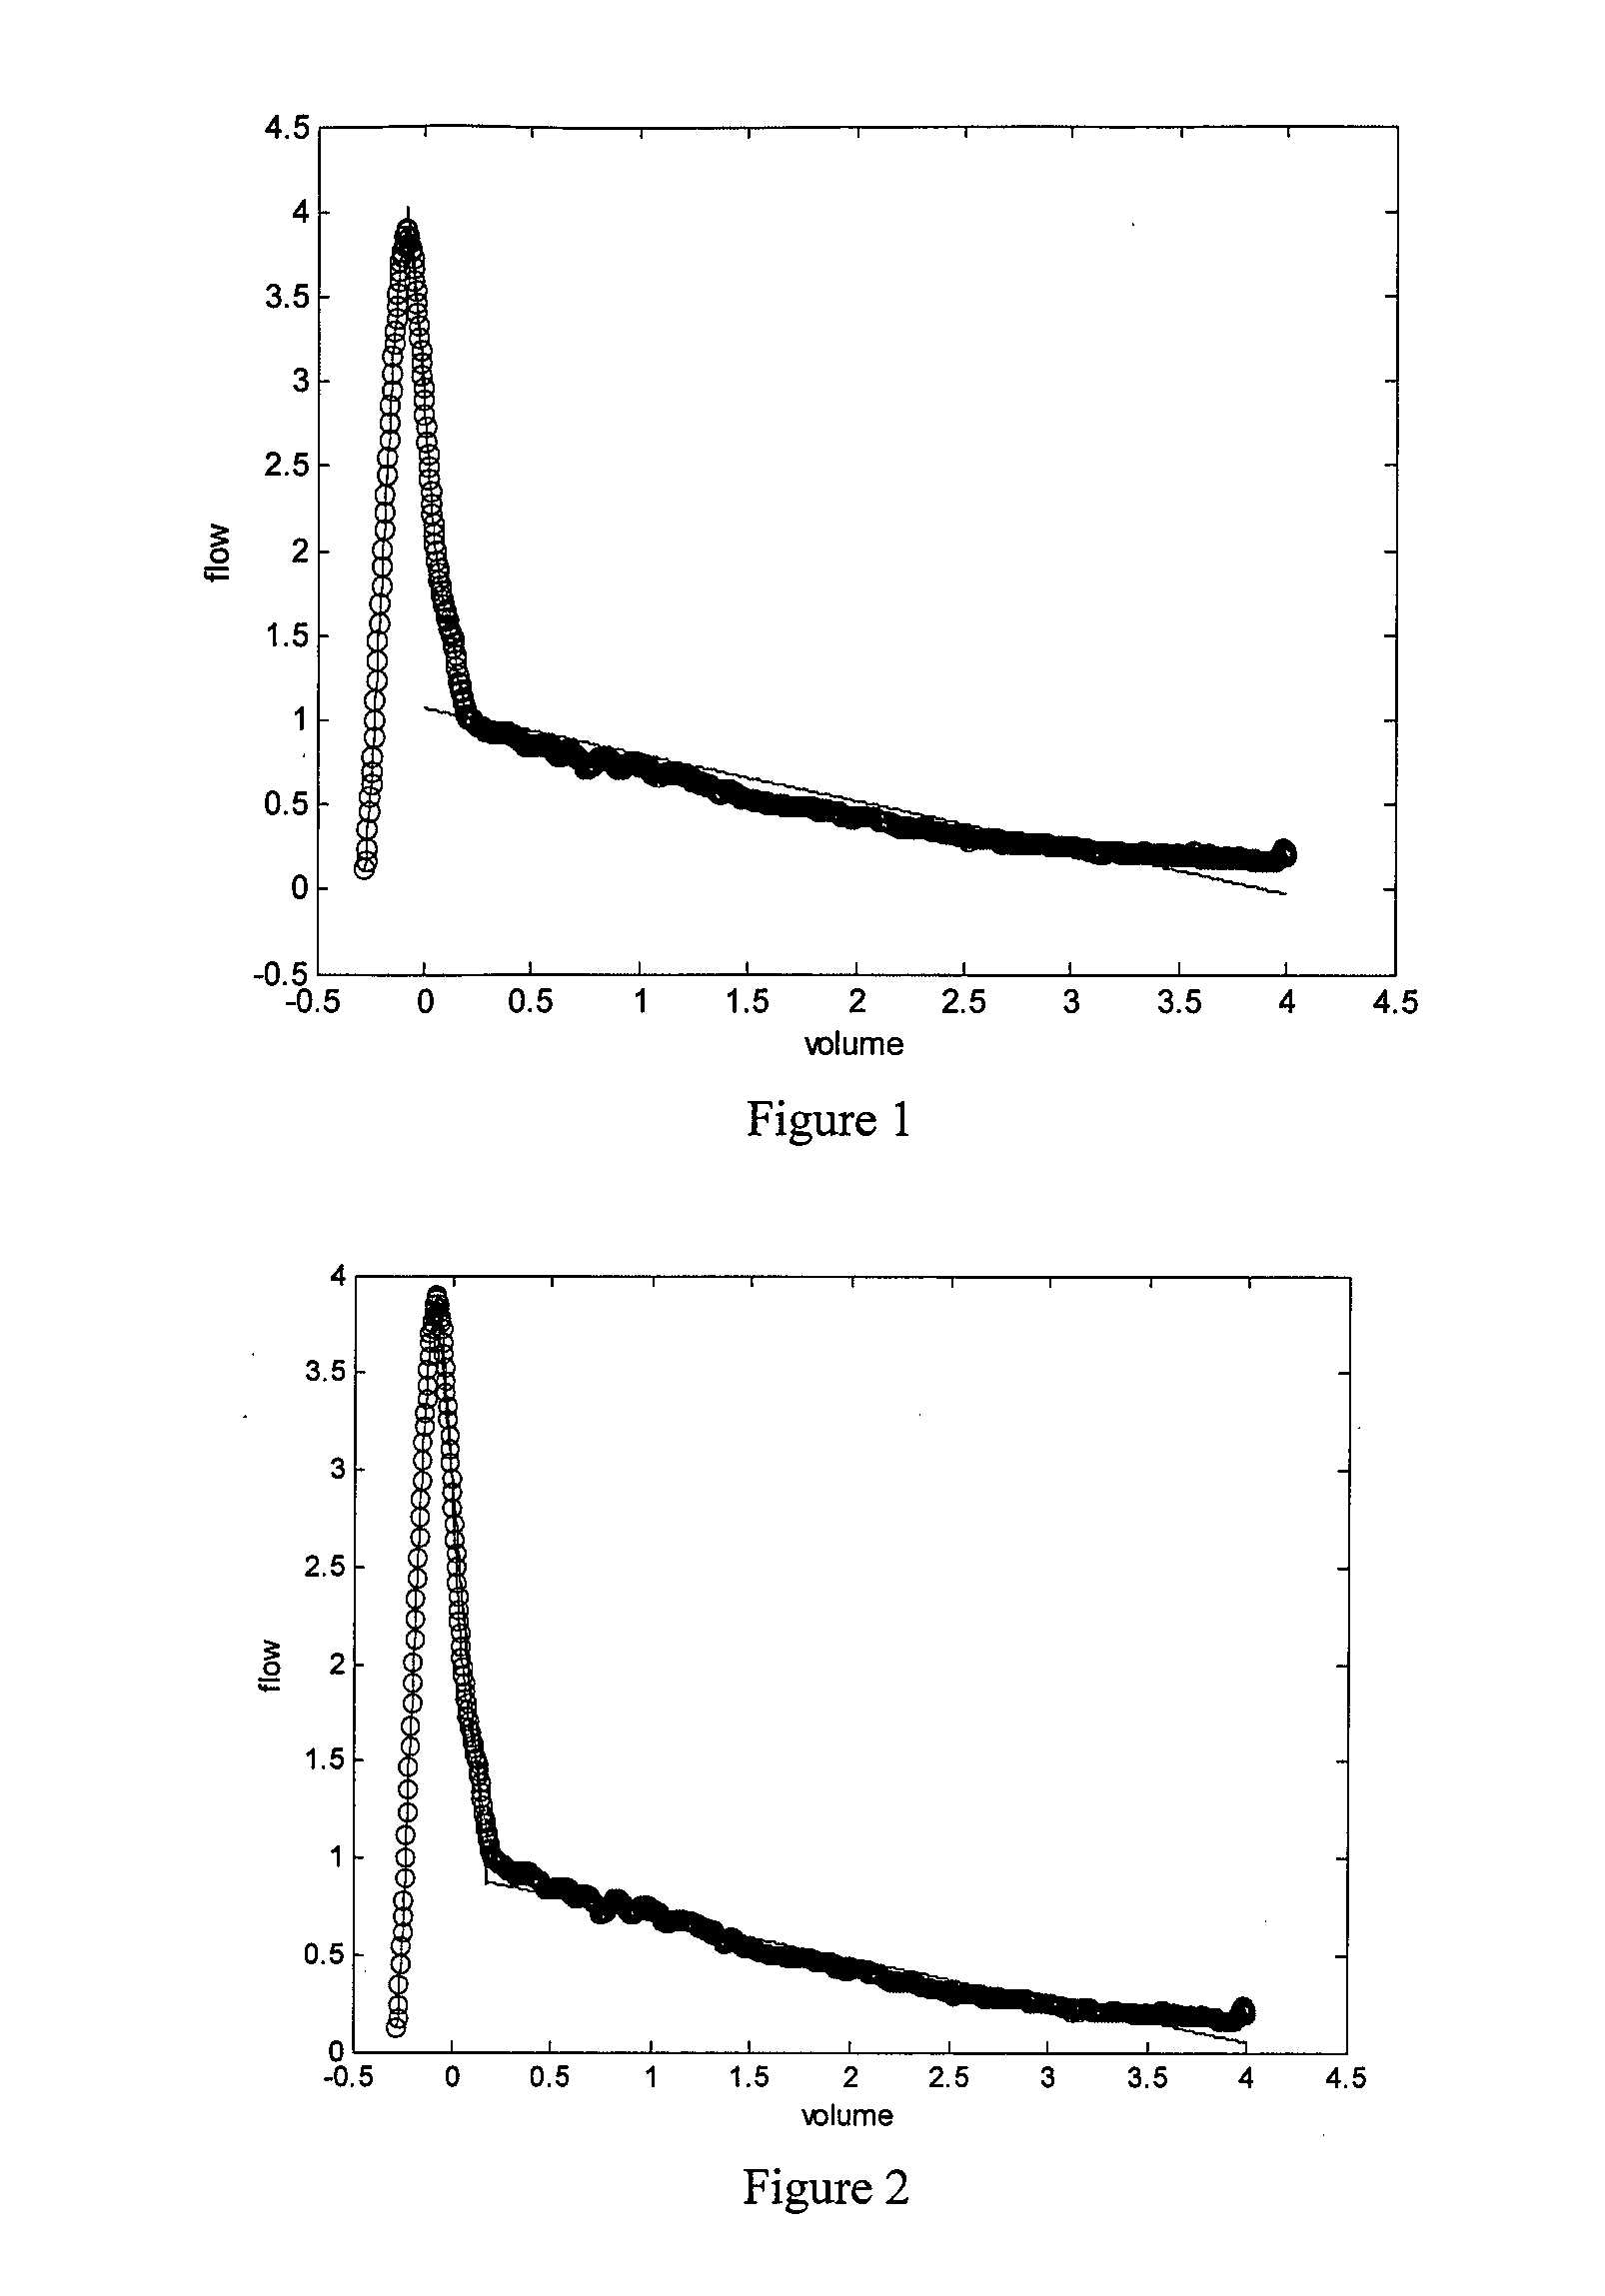
[0040]513 patients with >15 pack-years and >50 years were enrolled. Electronic data of the best spirometry (ATS / ERS criteria) were used to calculate the two best fitting linear regression curves on flow-volume loops from peak flow to end of expiration. The angle between both regression lines (AC) was used as surrogate marker of airway collapse. AC was related to diffusing capacity over alveolar ventilation (KCO), another functional variable known to be associated with emphysema but NOT accessible with spirometry in a general practise. AC was also related to semi-quantitative visual scores of emphysema on CT.
[0041]In 93% of patients (n=477) the computer model resulted in a correct quantification of mean AC, 156°±7° in healthy subjects (n=138) and 135°±10° in COPD patients (n=339). In subjects with FEV1 / FVC ratio >0.7, ACs were not different between emphysema and non-emphysema subgroups. In COPD patients however, the mean AC in the emphysema subgroup (n=238) was significantly lower as...
example 2
A Calculation Process
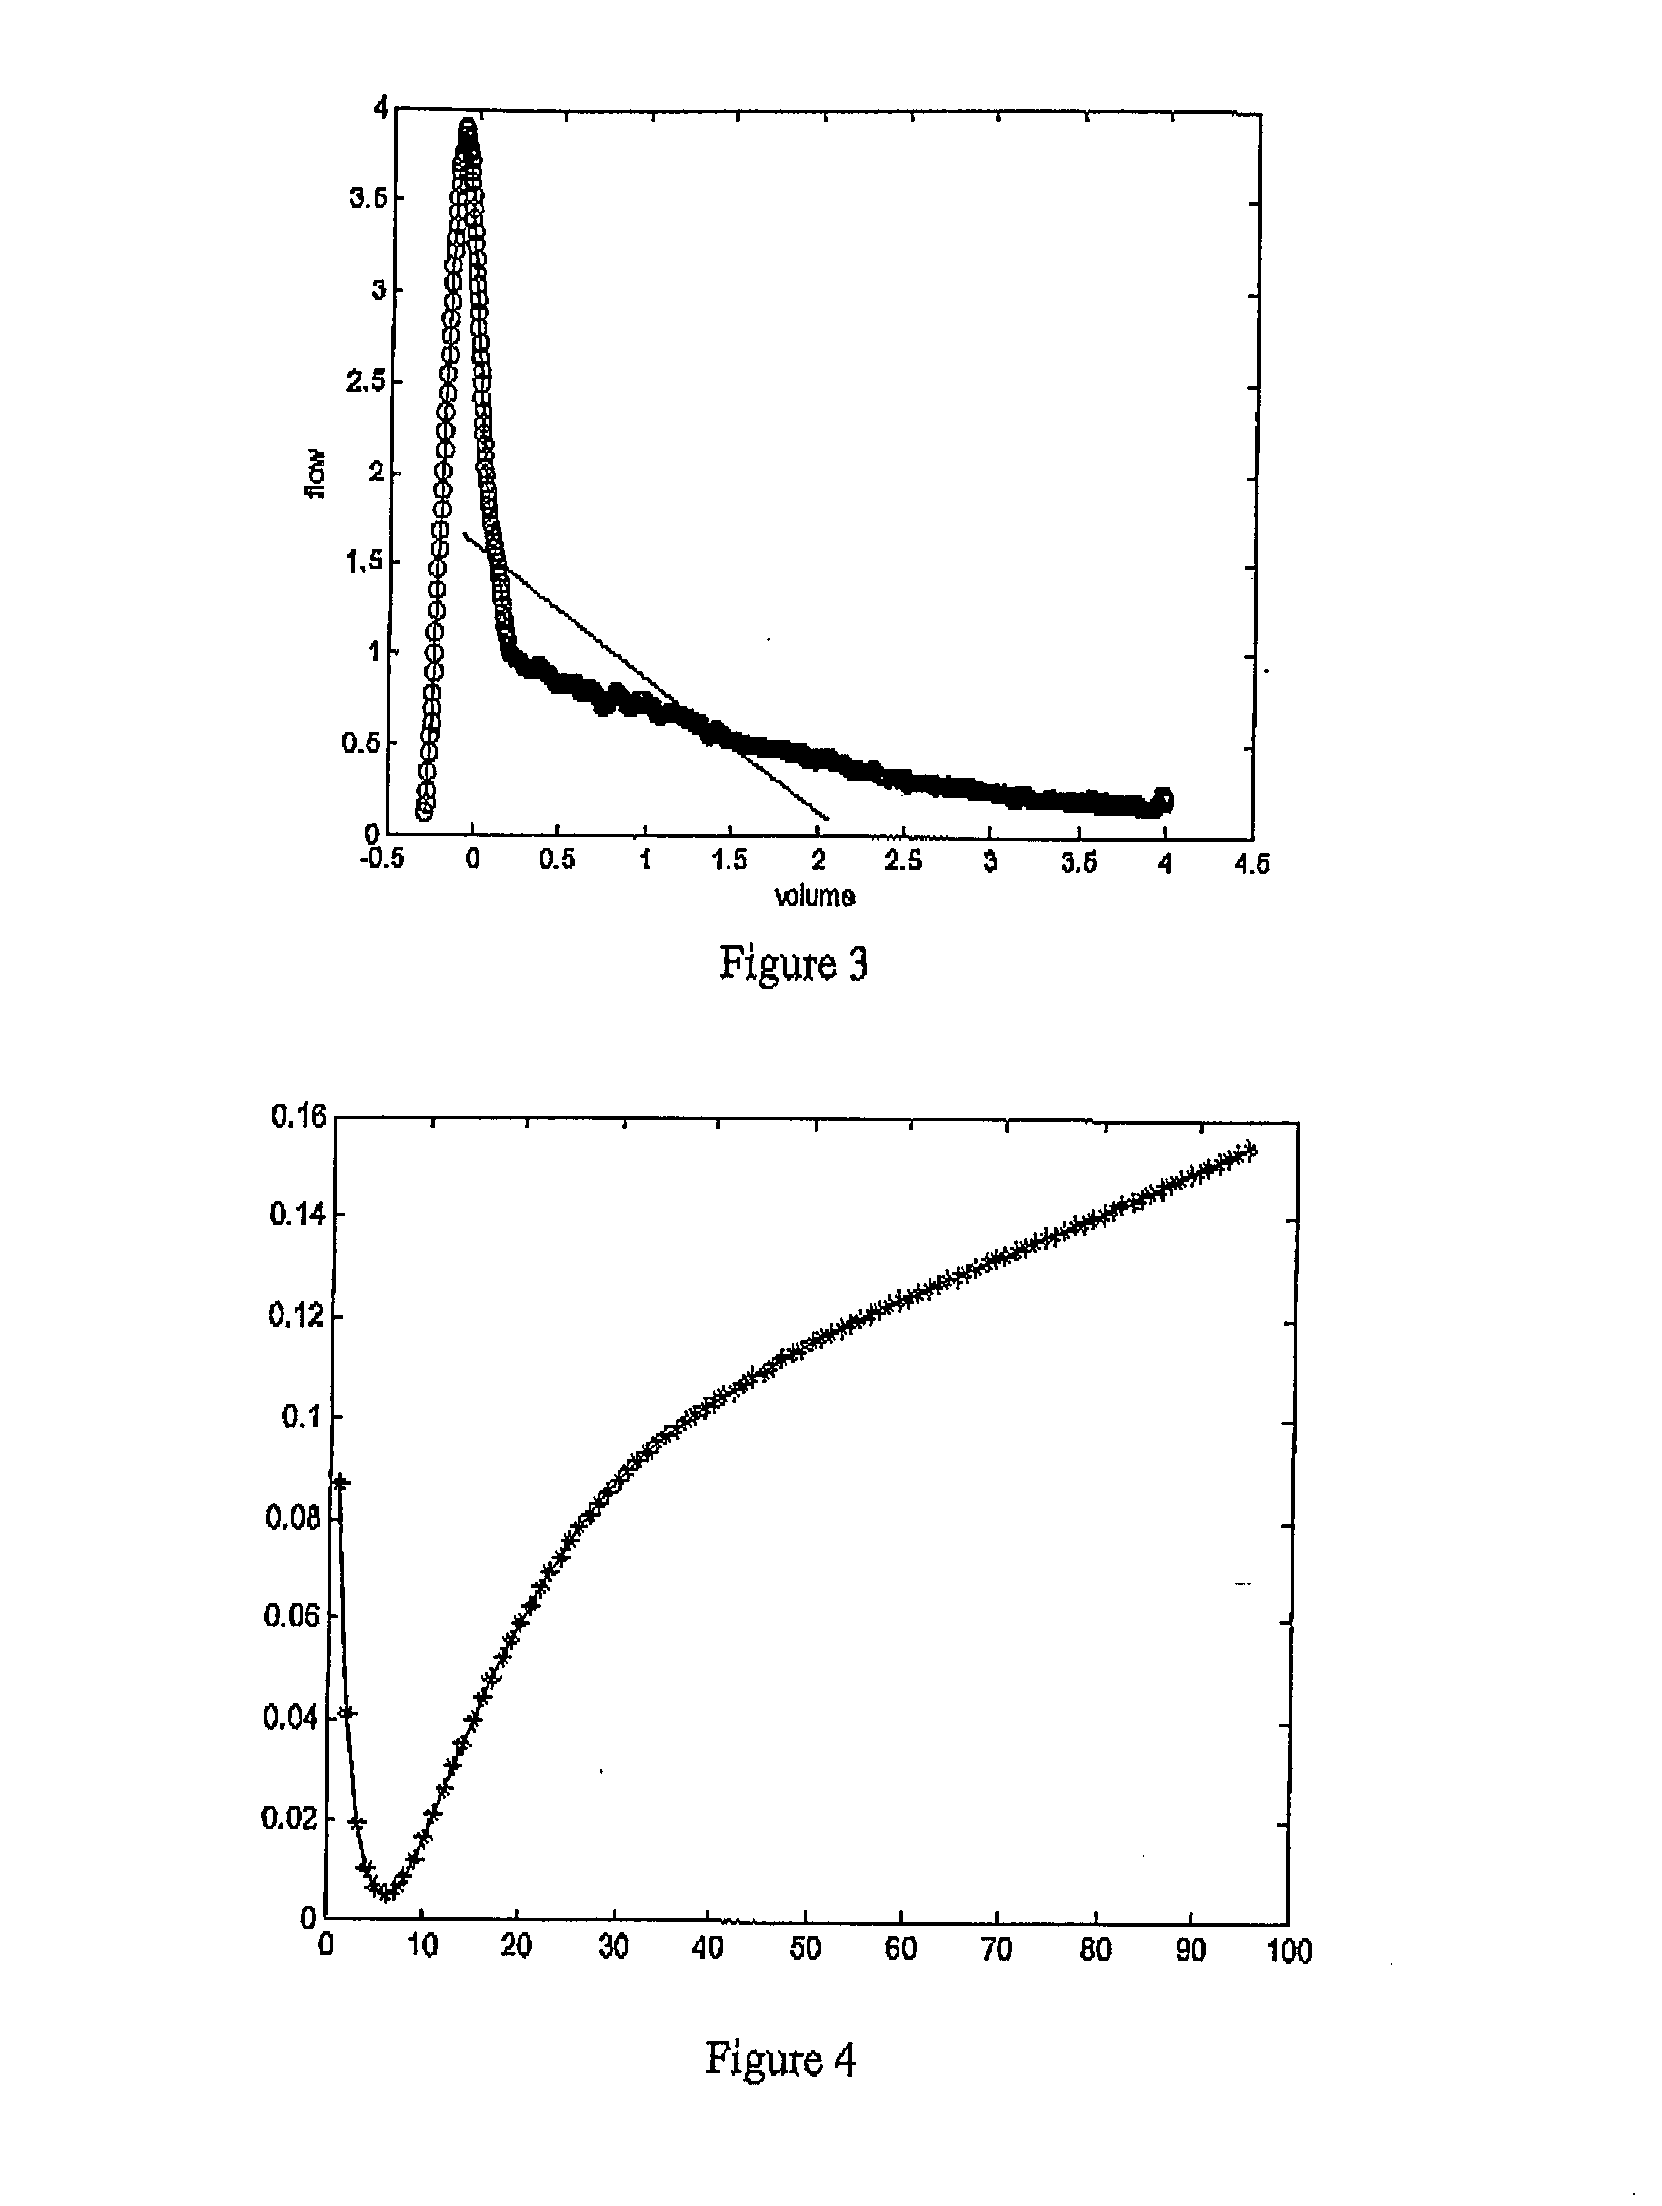
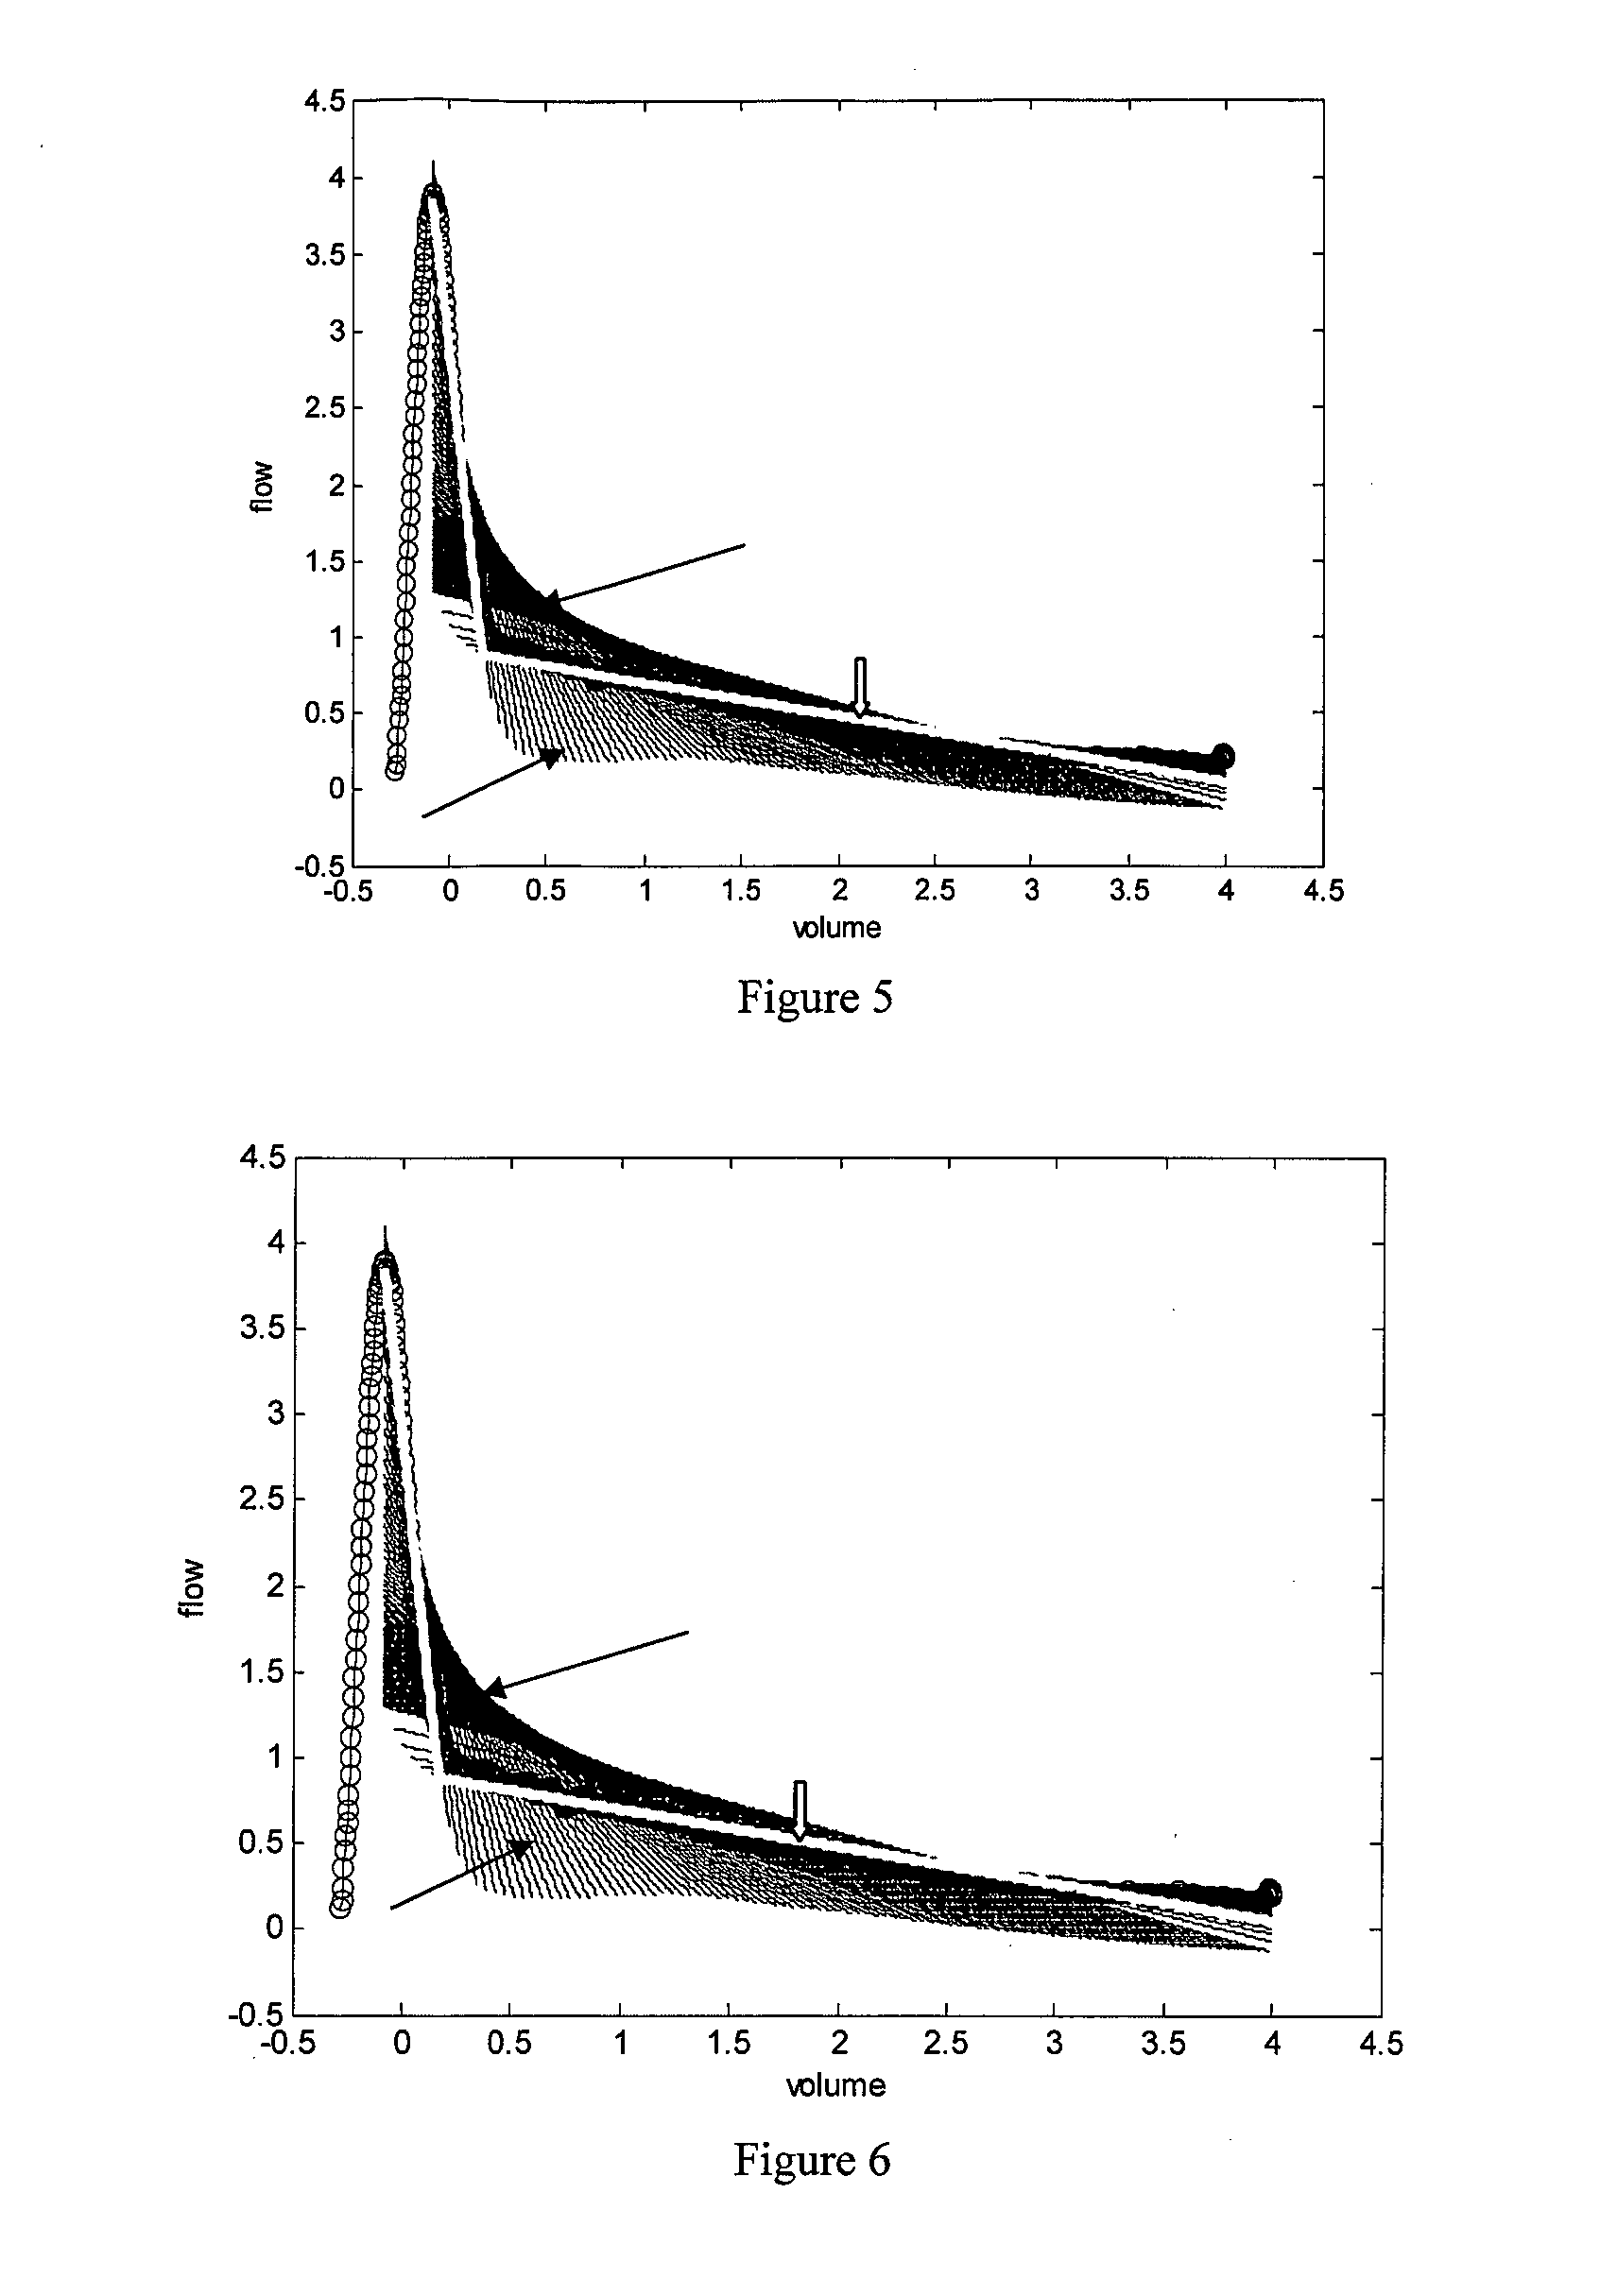
[0043]As first COPD calculator the peak-to-surface value of flow-volume curve or the flow-volume relationship. The peak-to-surface value is the peak value divided by the surface under the measured curve. As second COPD indicator the angle between two lines is calculated, which lines describe the point cloud between the peak and the maximal volume in the meaning that the mean square error between the data and fitted curve are minimal. Since it is initially not known which angle points to select or which portion of the data to fit with curve one and which of the remaining portion to fit with curve 2, the automated program makes different runs. For each run the automated program selects a new angle point with a 10 points interval starting at peakflow. For instance 1) for the first run (run 1) we select the angle point 1×10 (=10 samples) after the peak and a fit run is carried out 2) for the second run (run 2) an angle point is selected at 2×10 (=20 samples) of the ...
PUM
 Abstract
Description
Claims
Application Information