A Fast Matching Method of Spectral Characteristic Variables Based on Index Extremum

A technology of characteristic variables and matching methods, applied in the direction of color/spectral characteristic measurement, etc., can solve the problems of affecting the prediction accuracy of the model, failing to achieve fast detection, and high computational complexity, etc., achieving large degrees of freedom, easy operation, and technical methods simple effect

CN107271389BActive Publication Date: 2019-10-11GUILIN UNIVERSITY OF TECHNOLOGY
6 Cites 0 Cited by

Patent Information

Authority / Receiving Office
CN · China
Patent Type
Patents(China)
Current Assignee / Owner
Publication Date
2019-10-11

Smart Images

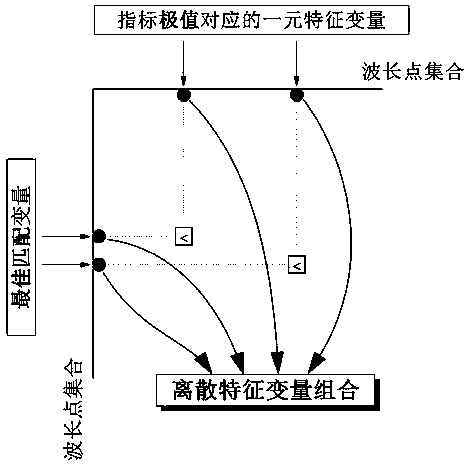
  • Figure 1
    Figure 1
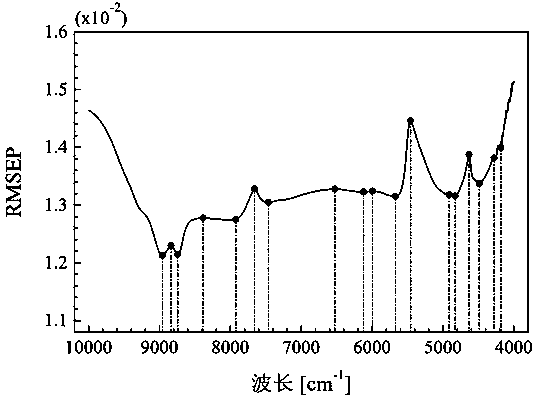
  • Figure 2
    Figure 2
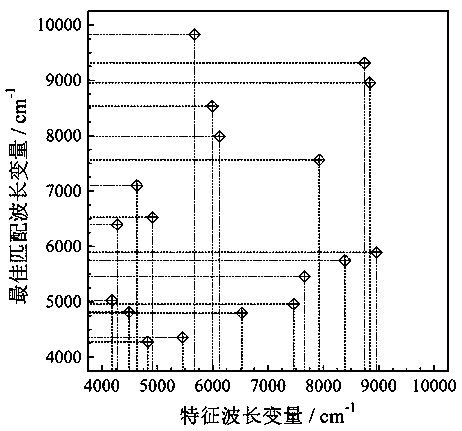
  • Figure 3
    Figure 3
Patent Text Reader

Abstract

The invention discloses an index extreme value based rapid matching method of spectrum characteristic variable. The method is characterized in that a simple linear model is treated as a spectrum correction prediction model for selecting valid characteristic variable; an unitary linear regression model is built for each variable (wavelength) in a spectrum variable set based on the law of lambert-beer; unitary characteristic variables corresponding to the peak value and the valley value are selected based on the target of model prediction index extreme value, and a second variable which can realize perfect matching with each unitary characteristic value is further found out to form a discrete characteristic variable set; and a spectrum correction model is built through the characteristic variable set and can be used for effectively overcoming the problem of spectrum collinearity which often occurs in a simple linear model. The method has the advantages of being simple and convenient in model, little in calculation workload, and high in freedom of selection; the method can be popularized and applied to the fields of raman, near infrared, intermediate infrared and ultraviolet spectrum analysis; and effective technological support is provided to the design of a small portable dedicated spectrograph.
Need to check novelty before this filing date? Find Prior Art

Description

technical field

[0001] The invention belongs to the technical field of model optimization in spectral analysis, and in particular relates to a fast matching method of spectral characteristic variables based on index extreme values. Background technique

[0002] Spectral analysis is a technique for qualitatively or quantitatively determining the chemical composition and content of a substance based on its spectrum. It has the advantages of simple and fast, non-destructive, real-time online, multi-component simultaneous detection, etc., and has been widely used in many fields such as environment, food, agriculture, and biomedicine. The application of spectral analysis techniques such as infrared spectroscopy, ultraviolet spectroscopy, and Raman spectroscopy first requires the use of corresponding spectrometers to measure spectral data. Full-spectrum general-purpose spectroscopic instruments are bulky and not easy to carry; full-spectrum scanning is performed without distincti...

Examples

Embodiment

[0019] Taking the near-infrared analysis of soil total nitrogen as an example, there are 135 soil samples in total, and each sample obtains the spectral values ​​of 1512 wavelength variables through spectral experiments, and the samples are divided into calibration sets and prediction sets, and the SMCVE method of the present invention is used to quantify To detect the total nitrogen content in soil samples, this case chooses to use the extreme value of the predicted root mean square deviation (RMSEP) curve as the goal of finding characteristic variables. The specific steps are:

[0020] Step 1: Establish a linear regression model for each variable (wavelength point) in all variable sets of the spectrum (full-spectrum wavelength set), and obtain the RMSEP curve of the single-element regression model for each wavelength as follows: figure 2 shown; Step 2, from figure 2 Select the peaks and troughs of the RMSEP curve, and determine 18 univariate characteristic variables for th...