A display method and display device of ECG scattered points

A technology of ECG scatter and scatter diagrams, which is applied in medical science, diagnosis, diagnostic recording/measurement, etc., can solve problems such as poor interactive performance, user visual confusion, and single display mode of ECG scatter points, and achieve improved The effect of diagnostic efficiency

Active Publication Date: 2020-11-03
EDAN INSTR
View PDF9 Cites 0 Cited by
  • Summary
  • Abstract
  • Description
  • Claims
  • Application Information

AI Technical Summary

Problems solved by technology

[0004] The embodiment of the present invention provides a display method and display device of ECG scattered points, aiming at solving the problems that the current display method of ECG scattered points is too single, the interactive performance is poor, and the user's visual confusion is easily caused.

Method used


Image

  • A display method and display device of ECG scattered points
  • A display method and display device of ECG scattered points
  • A display method and display device of ECG scattered points

Examples


Embodiment 1

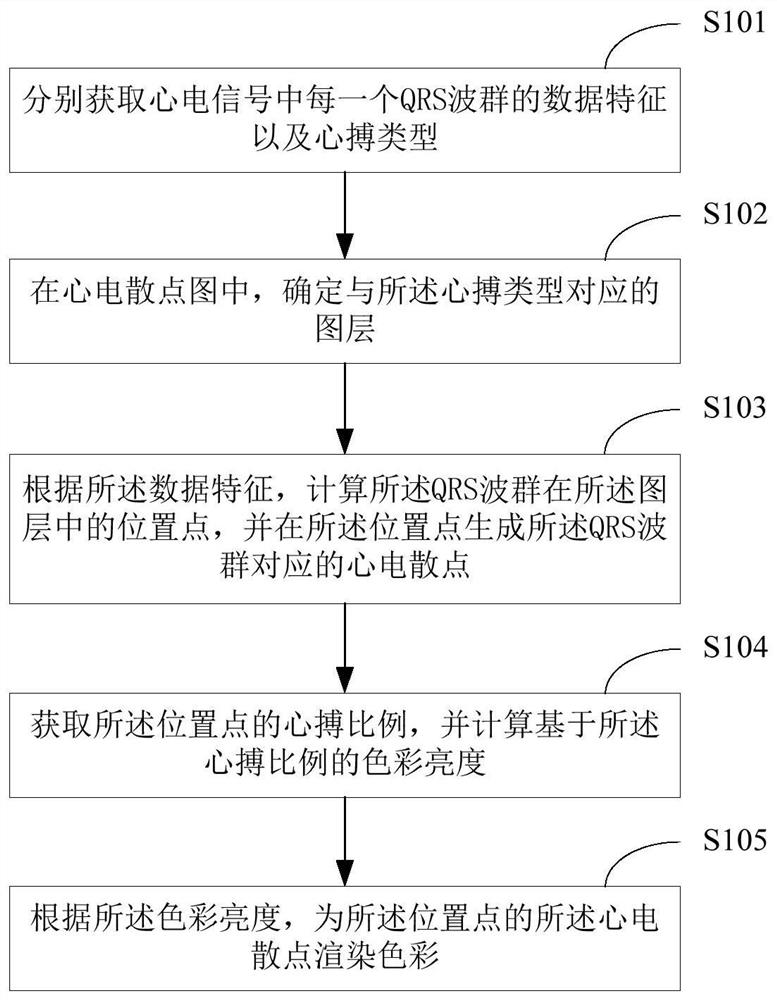
[0032] figure 1 The implementation flow of the method for displaying ECG scattered points provided by Embodiment 1 of the present invention is shown, and the details are as follows:

[0033] In S101, the data feature and heartbeat type of each QRS complex in the ECG signal are obtained respectively.

[0034] In this embodiment, the electrocardiographic signal is a physiological signal, including the electrocardiographic signal of a human body and the electrocardiographic signal of an animal body. By placing the measuring electrodes in the signal acquisition device on a certain part of the surface of the organism, a series of ECG data can be collected. The ECG data records the regular voltages that occur in each part of the body in each cardiac cycle. The ECG data describing the dynamic change of the voltage is the ECG signal, which is displayed in the signal acquisition device or the electrocardiogram device in the form of an ECG waveform.

[0035] Preferably, the collection...

Embodiment 2

[0073] In this embodiment, on the basis of Embodiment 1 of the present invention, the display mode of the ECG scattered points is further limited, as follows Figure 5 Shown:

[0074] In S501, in the ECG scatter diagram, one or more ECG scatter points selected by a user are acquired.

[0075] When it is detected that the pattern drawn by the user in the Lorenz scatter diagram or the time RR scatter diagram is a closed curve containing one or more ECG scatter points, it can be determined that the ECG scatter points selected by the user are closed curves ECG scattered point; or, when receiving the selection instruction of the location of the ECG scattered point, the ECG scattered point selected by the user can also be determined.

[0076] In S502, the ECG signal segment corresponding to each ECG scatter point selected by the user is displayed in the first window, and the ECG signal segment includes the QRS complex corresponding to the ECG scatter point.

[0077] In this embodi...

Embodiment 3

[0081] In this embodiment, on the basis of the second embodiment of the present invention, the display modes of the first window, the second window and the ECG scattergram are further limited, as follows Figure 6 shown, including:

[0082] In S601, the ECG signal is displayed in a second window.

[0083] In this embodiment, the second window may be called an ECG waveform window. The original ECG signals used to generate the above ECG scattered points are displayed in the second window, and the second window has a preset scroll bar. By default, because the ECG signal has a relatively long time length, only a part of the ECG signal is displayed, and this part of the segment contains the ECG signal segment selected by the user in the first window above. QRS complex, and locate the QRS complex in the form of a marked box.

[0084] When the scroll bar dragging instruction sent by the user is received, the remaining segments in the ECG signal will be displayed. Therefore, the us...


PUM


Abstract

The present invention is applicable to the field of biological signal processing, and provides a method and device for displaying ECG scatter points, including: separately acquiring the data characteristics and heartbeat types of each QRS wave group in the ECG signal; , determine the layer corresponding to the heartbeat type; calculate the position point of the QRS complex in the layer according to the data characteristics, and generate the corresponding ECG scattered points of the QRS complex at the position point; obtain the heartbeat ratio of the position point, And calculate the color brightness based on the heart beat ratio; according to the color brightness, render the color for the ECG scatter points at the position point. The present invention reflects the overall signs of ECG scattered points of different heartbeat types based on the depth of the color of the scattered points and different layers, avoiding the problems of too single display mode of the scattered points of ECG and poor interactive performance, and ensuring In the case of scattered points, the user will not have visual confusion, so that the user can quickly identify the QRS complex of abnormal rhythm from the ECG scatter diagram, thereby improving the diagnostic efficiency.

Description

technical field [0001] The invention belongs to the field of biological signal processing, and in particular relates to a display method and a display device of electrocardiographic scattered points. Background technique [0002] With the development and application of Holter, in order to meet the clinical needs, many new statistical tools are constantly being derived. Among them, ECG scattergram is an advanced tool that uses mathematical models to assist in the analysis of Holter ECG. As a non-linear analysis tool, the ECG scattergram is mostly used to study the ECG signals on the body surface. In general, even if the measured heartbeat reaches 100,000 within 24 hours, the ECG scattergram can still The 100,000 heartbeats are studied as a whole to show the overall characteristics of the dynamic electrocardiogram. Therefore, it can be widely used in the research of arrhythmia analysis and heart rate variability analysis, and in the diagnosis of atrial flutter, It has great ...

Claims


Application Information

Patent Timeline
Patent Type & Authority Patents(China)
IPC IPC(8): A61B5/0402A61B5/0472A61B5/366
CPCA61B5/7264A61B5/366A61B5/318
Inventor 李叶平
Owner EDAN INSTR
Why Eureka
Try Eureka