Comparison correlation visual analysis method aimed at two kinds of hierarchical data, and application

An analysis method, a technology of hierarchical data, applied in the field of information visualization, which can solve problems such as visual clutter

Active Publication Date: 2016-01-06
BEIJING TECHNOLOGY AND BUSINESS UNIVERSITY
View PDF3 Cites 16 Cited by
  • Summary
  • Abstract
  • Description
  • Claims
  • Application Information

AI Technical Summary

Problems solved by technology

The advantage of this method is that the display space of the root node of the radial ring is fully utilized. The disadvantage is that when the nodes inside the root node of the radial ring have a hierarchical structure or there are too many nodes, visual clutter will appear

Method used


Image

  • Comparison correlation visual analysis method aimed at two kinds of hierarchical data, and application
  • Comparison correlation visual analysis method aimed at two kinds of hierarchical data, and application
  • Comparison correlation visual analysis method aimed at two kinds of hierarchical data, and application

Examples


Embodiment Construction

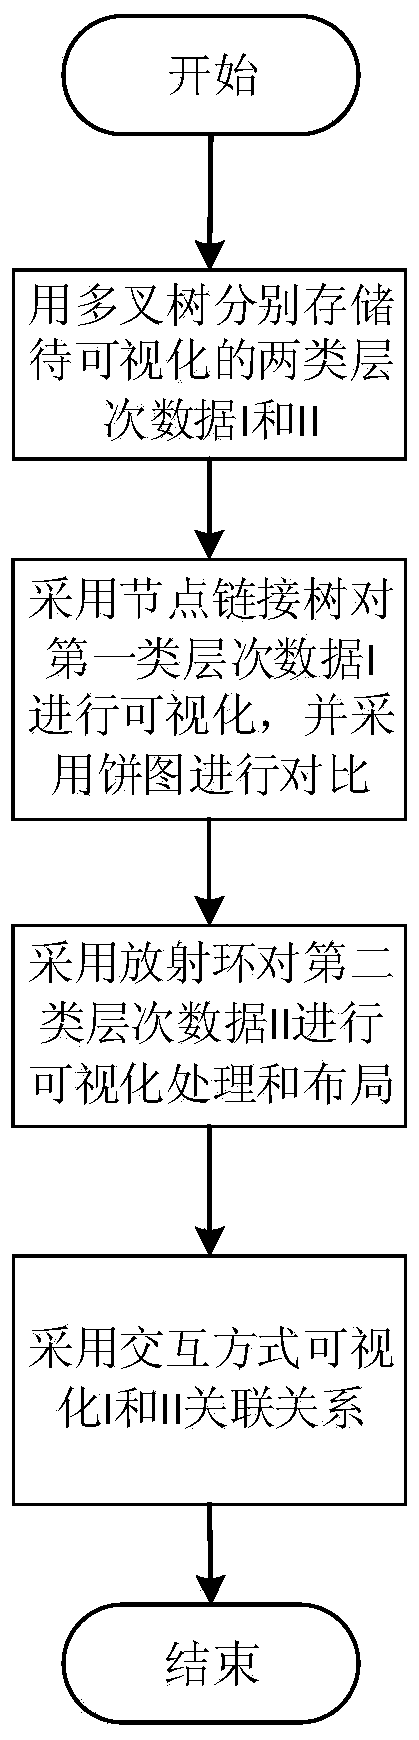
[0040] Below in conjunction with accompanying drawing, further describe the present invention through embodiment, but do not limit the scope of the present invention in any way.

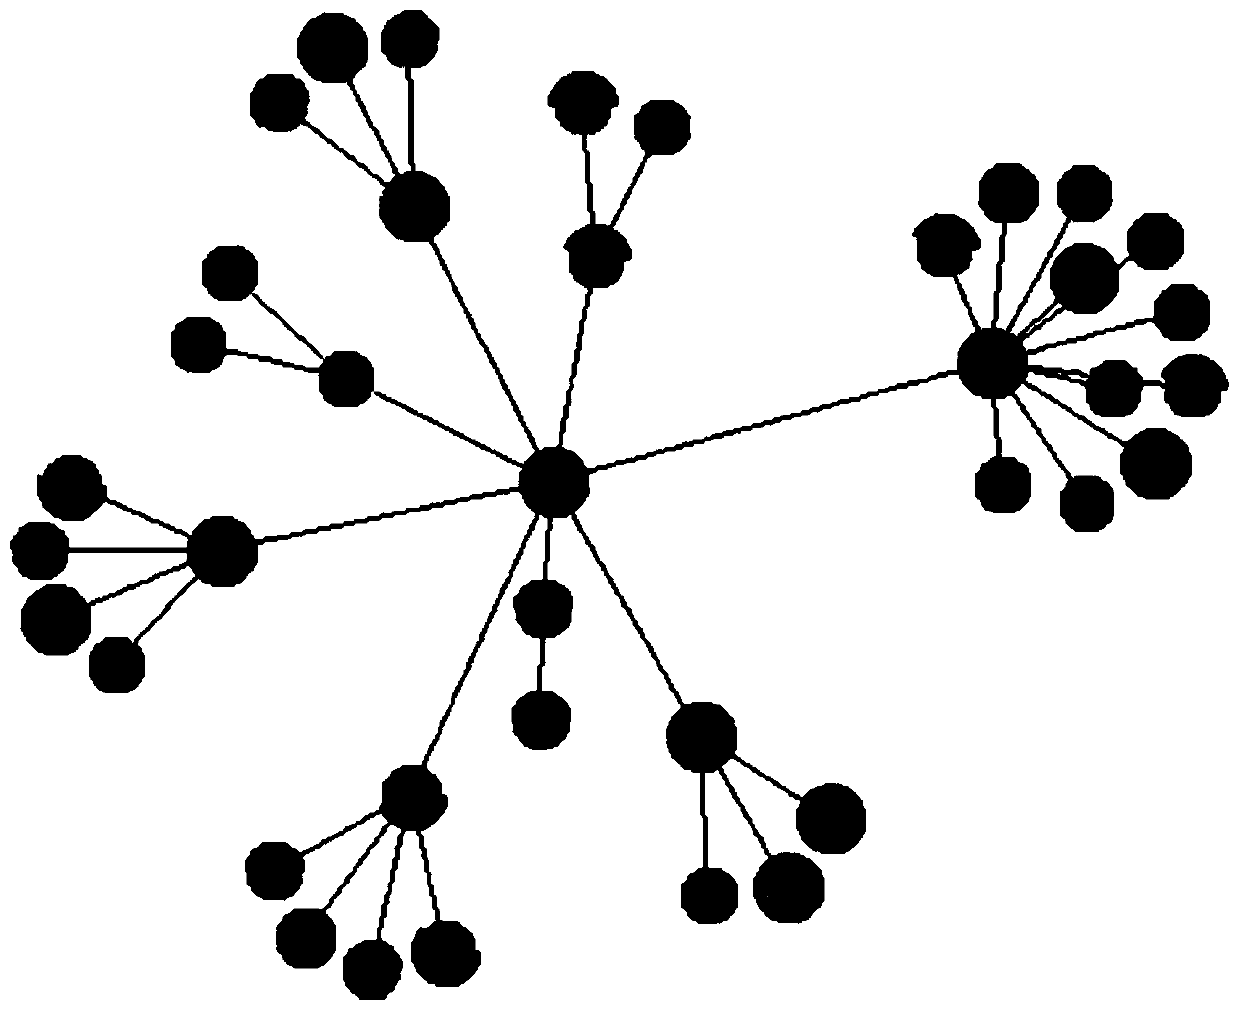
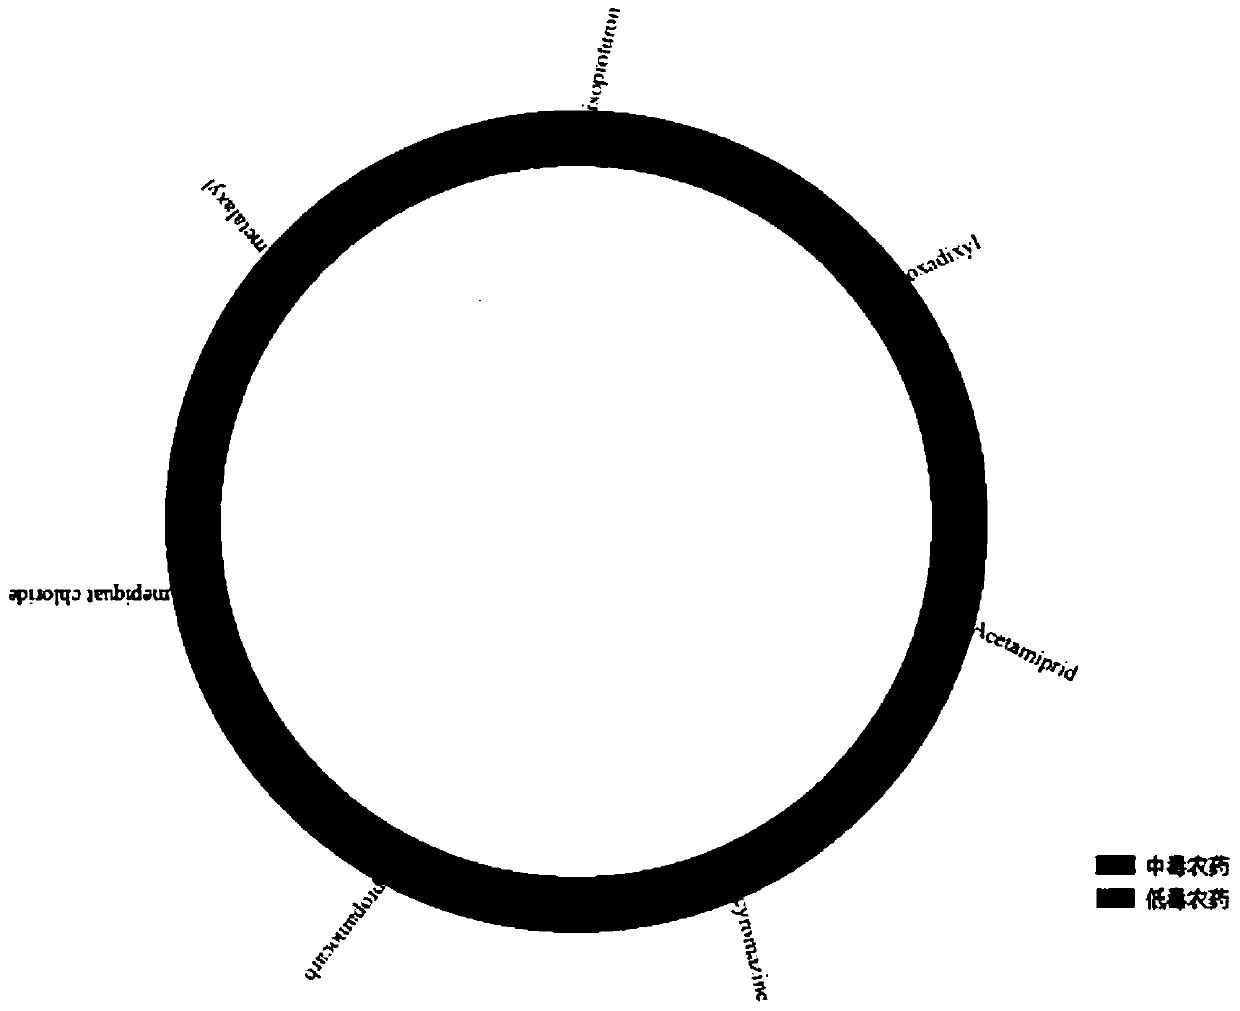
[0041] Utilizing the comparative correlation visual analysis method for two types of hierarchical data provided by the present invention, the embodiment analyzes the similarities and differences between them by comparing the detection of pesticides in agricultural products in different regions, and by comparing the detection of pesticides in the same region The detection of pesticides in agricultural products in different time periods is used to analyze the changes of pesticide application in this area.

[0042] The embodiment takes two types of hierarchical data (such as: agricultural products and pesticides) as an example to carry out corresponding comparative correlation analysis, and divides a certain type of hierarchical data into two parts for targeted comparison of data differences (such as: co...


PUM


Abstract

The invention discloses a comparison correlation visual analysis method (comparison relevance tree) aimed at two kinds of hierarchical data, and application. The method comprises: respectively using a node-link tree based on force orientation and a space filling tree based on radiation rings to represent two kinds of hierarchical data, nodes in the node-link tree representing as a pie chart, space filling of the radiation rings being distinguished by colors; and through an interactive method, showing comparison and correlation of different hierarchical data of the two kinds of data. The visual method can show hierarchical relations and association of two different kinds of hierarchical data at the same time, and can directly compare correlation information and other data of the same kind of hierarchical data, and is intuitive and effective, and visual disorder is prevented. The method helps users to efficiently check associations among data, so as to perform further data analysis.

Description

technical field [0001] The invention belongs to the field of information visualization, and specifically relates to a visual analysis method (comparative correlation tree) and application for comparing and correlating two types of hierarchical data, which directly displays the comparison and correlation of different levels of data of the two types of data through interactive means. Background technique [0002] In real work and life, multiple interconnected hierarchical structures widely exist in various fields such as food safety, financial information, and social networks. It is also a very important topic to compare and analyze two data with the same hierarchical structure. . [0003] In 2007, YingTuandHan-WeiShen proposed a visualization method that can show changes in tree diagrams. This method is actually a comparison of two tree diagrams at different time points. They propose a treemap layout algorithm that reduces layout mutations and produces a persistent visual p...

Claims


Application Information

Patent Timeline
Patent Type & Authority Applications(China)
IPC IPC(8): G06F17/30
CPCG06F16/904
Inventor 陈谊冯玉超刘莹杜晓敏
Owner BEIJING TECHNOLOGY AND BUSINESS UNIVERSITY
Why Eureka
Try Eureka