Method and device for drawing trend graphs applied in industrial monitoring system

A monitoring system and trend graph technology, applied in special data processing applications, instruments, electrical digital data processing, etc., can solve problems such as inability to display all data, inability to display the overall change trend, and inconsistency

Active Publication Date: 2017-11-10
ZHEJIANG SUPCON SOFTWARE +1
View PDF4 Cites 0 Cited by
  • Summary
  • Abstract
  • Description
  • Claims
  • Application Information

AI Technical Summary

Problems solved by technology

[0004] Among them, the method of using all the collected data points as the trend points of the trend line has the advantage that no data processing is required and the operation is simple. When the data is large-capacity data, the display area cannot display all the data, resulting in an incomplete trend line drawn and unable to show the overall change trend presented by all data points
[0005] When the sampling results are used as the trend points of the trend line, since the selected trend points have certain randomness, the trend represented by the trend line formed by these trend points also has certain randomness, which may lead to the trend shape represented by the trend line There is a large discrepancy between the actual trend of the production process, so that the trend shape indicated by the trend line does not match the actual trend, which may lead to misjudgment of the trend of the production process by technicians

Method used


Image

  • Method and device for drawing trend graphs applied in industrial monitoring system
  • Method and device for drawing trend graphs applied in industrial monitoring system
  • Method and device for drawing trend graphs applied in industrial monitoring system

Examples


Embodiment Construction

[0047] The specific implementation of the method and device for drawing a trend graph applied in an industrial monitoring system provided by the present invention will be described in detail below in conjunction with the accompanying drawings.

[0048] First, combine Figure 1 to Figure 5 The drawing method of the trend graph applied in the industrial monitoring system provided by the present invention is described.

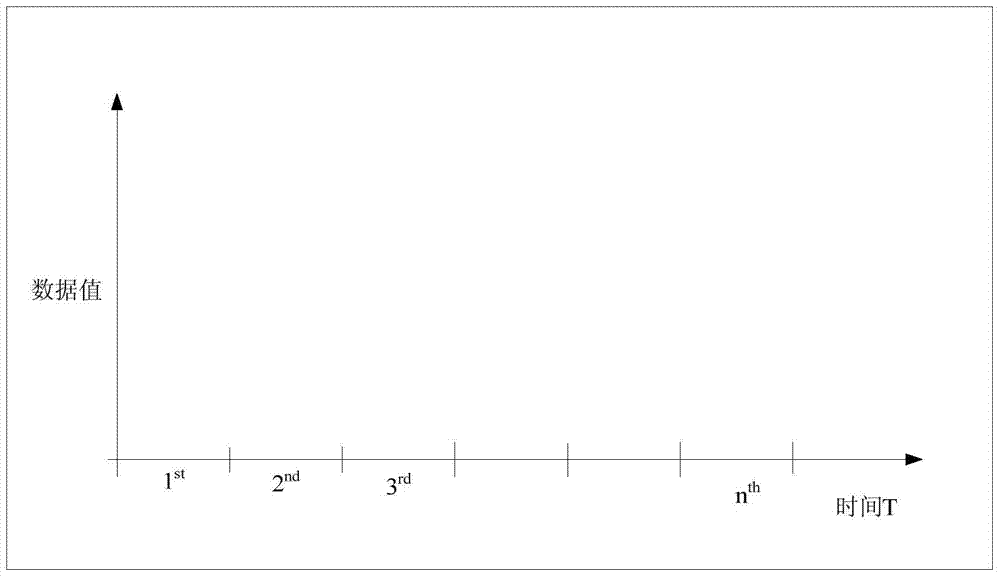
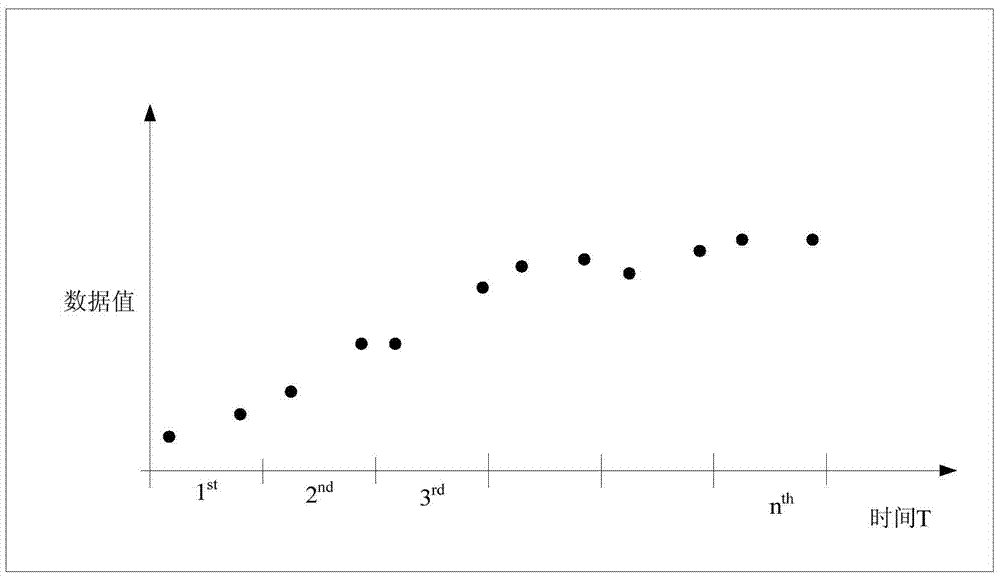
[0049] It should be noted that the industrial monitoring system described in the embodiment of the present invention includes a display device capable of displaying the trend change of the production process, such as a display screen. A rectangular coordinate system with time as the X axis and data values ​​as the Y axis is established in the display area of ​​the display device.

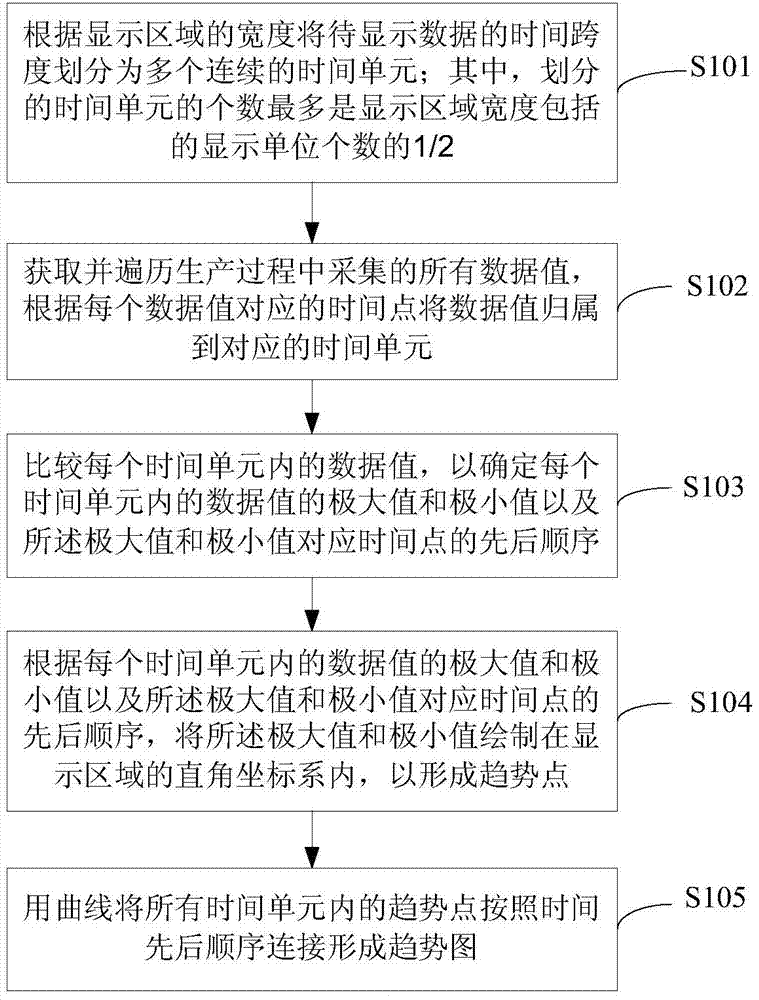
[0050] figure 1 It is a flow chart of the drawing method of the trend graph applied in the industrial monitoring system provided by the present invention. Such as figure 1 As shown...


PUM


Abstract

The invention provides a method and device for drawing a trend graph applied in an industrial monitoring system. The drawing method includes: dividing the time span of the production process into a plurality of continuous time units according to the width of the display area; acquiring and traversing All data values ​​in the production process are assigned to the corresponding time unit according to the corresponding time point of each data value; compare the data values ​​in each time unit to determine the maximum value of the data value in each time unit value and minimum value and the order of corresponding time points of the maximum value and minimum value; the maximum value and minimum value are drawn in the Cartesian coordinate system of the display area to form trend points; The curve connects the trend points in all time units in chronological order to form a trend graph. This drawing method can completely display the entire change trend of the production process in the display area.

Description

technical field [0001] The invention relates to the field of industrial control, in particular to a method and device for drawing a trend graph applied in an industrial monitoring system. Background technique [0002] In the field of industrial control, the trend graph can visually show the change process of the analog quantity, and is an indispensable part of some industrial monitoring software. Normally, a trend graph is a two-dimensional coordinate graph with time as the X axis and trend points as the Y axis. And in order to show the change trend of the data value more clearly, in the trend graph, use smooth lines to connect these trend points to form a trend line, which makes it easier for relevant personnel to study the production process, so as to implement effective monitoring of the production process. [0003] When drawing a trend chart, the most important thing is how to determine the trend point. At present, there are mainly two methods to determine the trend po...

Claims


Application Information

Patent Timeline
Patent Type & Authority Patents(China)
IPC IPC(8): G06F19/00
Inventor 苏宏业卜梓琴陆海琛
Owner ZHEJIANG SUPCON SOFTWARE
Why Eureka
Try Eureka