A method and system for quickly loading and displaying massive images in a correlation graph

A display method and correlation diagram technology, applied in the computer field, can solve the problems of suspended interface and inoperability, and achieve the effect of ensuring uniformity, speeding up the display process, and speeding up the visual analysis.

Active Publication Date: 2018-05-08
北京航天理想科技股份有限公司
View PDF4 Cites 0 Cited by
  • Summary
  • Abstract
  • Description
  • Claims
  • Application Information

AI Technical Summary

Problems solved by technology

When loading a large image or loading a large number of photos at a time, it will be very slow. During this process, the interface is in a state of suspended animation and cannot be operated

Method used


Image

  • A method and system for quickly loading and displaying massive images in a correlation graph
  • A method and system for quickly loading and displaying massive images in a correlation graph
  • A method and system for quickly loading and displaying massive images in a correlation graph

Examples


Embodiment Construction

[0059] The present invention will be described in further detail below through specific embodiments and in conjunction with the accompanying drawings.

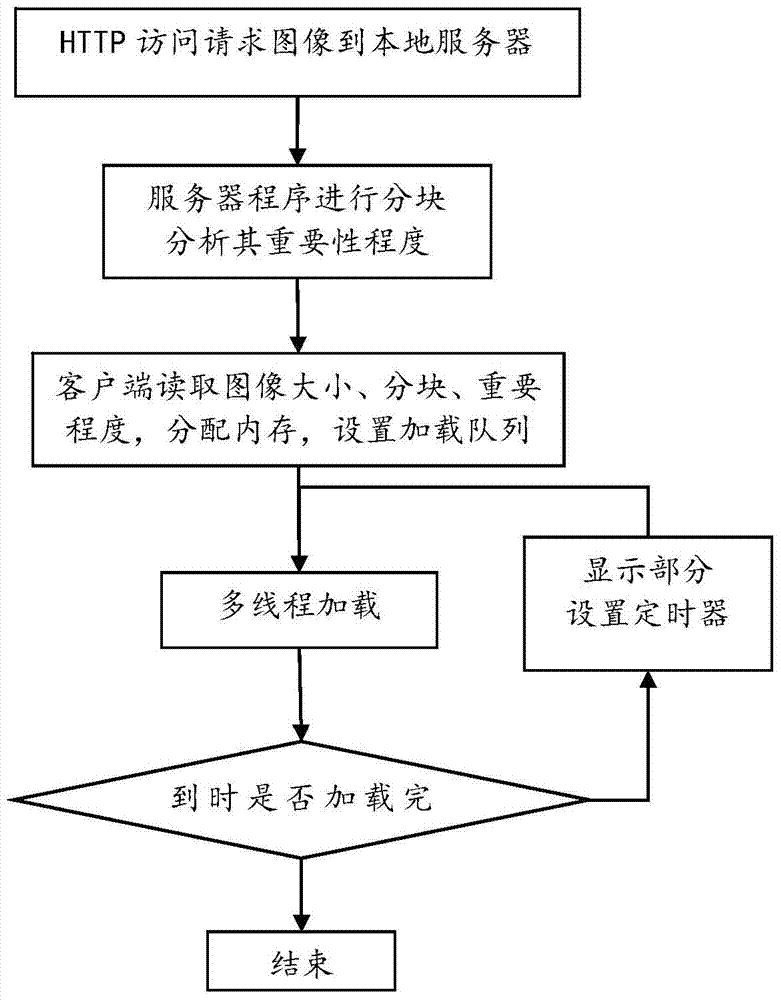
[0060] Such as figure 1 As shown, a method for quickly loading and displaying a large number of images in an association graph according to an embodiment of the present invention includes:

[0061] Step 1, using the HTTP protocol to preload the image to be loaded from the remote storage system to the memory of the local server, and analyze the image to obtain the image and the index value of the image.

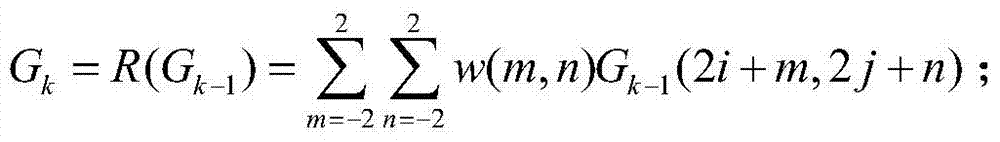
[0062] Step 2, the local server divides the image into blocks, divides the image into m*n blocks, and uses the Itti visual perception model to extract the salient areas of the image blocks. The model makes comprehensive use of Gabor pyramid and Gaussian pyramid to divide the image to be loaded and extract salient regions. Among them, the basic principle of Itti: first divide the candidate area that may become a salient area ...


PUM


Abstract

The invention discloses a method for quickly loading and displaying a large number of images in an association graph, comprising: step 1, using the HTTP protocol to preload the image to be loaded from a remote storage system into a memory of a local server, and analyze the image , analyze the image and the index value of the image; step 2, the local server divides the image into blocks, divides the image into m*n blocks, and uses the Itti visual perception model to extract the salient areas of the image block; step 3. The client sets the image block transmission queue according to the importance of the image block, and reads the image block in a multi-threaded manner; step 4, multi-thread loading, setting a timer; step 5, judging the integrity of the image read, Refresh the display. The beneficial effects of the present invention are: realizing the fast loading and displaying method of massive images, ensuring the quality of the images, improving the loading efficiency, and saving the corresponding time for client requests.

Description

technical field [0001] The present invention relates to the field of computer technology, in particular to a method and system for quickly loading and displaying massive images in an associated graph. Background technique [0002] Information visualization is an interdisciplinary field, which aims to study the visual presentation of large-scale non-numerical information resources, and use graphics and image technologies and methods to help people understand and analyze data. The information visualization system is a system that visualizes and analyzes a group of complex relationships in the form of a network diagram, and has a wide range of applications in real life. When using a visual information system for analysis, it is necessary to analyze the relationship between personnel, and it is more intuitive and easy to analyze these relationships by using an association diagram to show them. [0003] Usually, due to management and security considerations, the images used in t...

Claims


Application Information

Patent Timeline
Patent Type & Authority Patents(China)
IPC IPC(8): G06F9/52G06T1/20G06T7/11G06T7/136G06K9/46
Inventor 李瑞瑞袁静梁文贯
Owner 北京航天理想科技股份有限公司
Why Eureka
Try Eureka