A real-time analysis method of distribution network power supply capacity based on gis space service

A technology for real-time analysis and power supply capacity, applied in data processing applications, instruments, calculations, etc., can solve uneven construction quality and operation and maintenance level, restrict distribution network management, distribution network power supply capacity, power supply service quality, grid structure Weakness and other problems, to achieve the effect of improving the power supply capacity of the distribution network and the lean management of the distribution network, improving the reliability of the power supply of the distribution network and customer satisfaction, and improving the efficiency of operation and maintenance

Active Publication Date: 2022-03-08
STATE GRID FUJIAN ELECTRIC POWER CO LTD +1
View PDF8 Cites 0 Cited by
  • Summary
  • Abstract
  • Description
  • Claims
  • Application Information

AI Technical Summary

Problems solved by technology

However, most of the grid structures of power distribution systems are relatively weak, and the construction quality and operation and maintenance level are uneven, resulting in a relatively prominent contradiction between the power supply capacity of the distribution network and the level of electricity demand.
In some areas, especially in the urban-rural fringe areas, the phenomenon of overloading of distribution transformers is still serious. Power supply "stuck", frequent power outages, low voltage and emergency repair services are still the focus of customer complaints, which restrict the company's distribution network management and distribution network power supply. Improvement of capacity and power supply service quality

Method used


Image

  • A real-time analysis method of distribution network power supply capacity based on gis space service
  • A real-time analysis method of distribution network power supply capacity based on gis space service

Examples


Embodiment Construction

[0026] The present invention will be further described below in conjunction with the accompanying drawings and embodiments.

[0027] (1) Real-time analysis

[0028] Real-time outage analysis

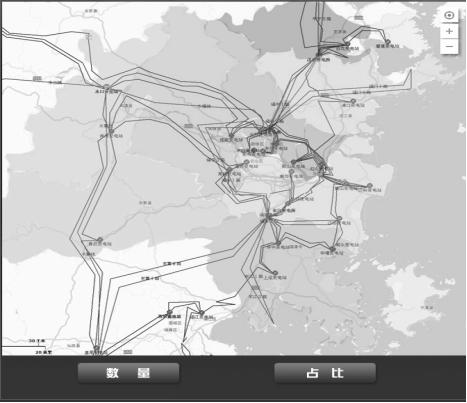
[0029] Through real-time extraction of 10 kV power outage data of DMS system (including public lines and dedicated lines), power outage data of 10 kV distribution transformers in the power consumption information collection system (including public distribution transformers and special distribution transformers), combined with PMS system equipment File information and planned power outage information and data such as line and distribution transformer location information in the GIS system, distribution transformer and feeder geographic location based on the GIS map (such as figure 1 As shown), the current situation of power outage distribution transformers and power outage feeders is displayed on the map, and the severity of power outages of distribution transformers and feeder lines in...


PUM


Abstract

The invention discloses a real-time analysis method of distribution network power supply capacity based on GIS space service, including real-time power outage data analysis, real-time low-voltage line analysis, and real-time heavy overload station area analysis; according to historical power outage data, real-time power outage data, from regional distribution Analysis of frequent power outages and time distribution, and early warning of frequent power outage areas and time periods; associated power outage impact, fault repair, distribution network investment and user complaint information, analysis of the rationality of planned power outage arrangements, distribution network fault repair efficiency, and different regions Sensitivity to power outages and effectiveness of distribution network investment; using GIS space services to display the real-time status and analysis results of distribution transformers and feeders on the map. The present invention realizes the positioning and tracking of abnormal distribution transformer information, and the image display of regionalized abnormality degree, and further conducts auxiliary correlation analysis on abnormal station areas and various related factors, deeply analyzes the influencing factors of distribution network power supply capacity, and provides decision-making basis for distribution network transformation .

Description

technical field [0001] The invention relates to the technical field of power grid security, in particular to a method for real-time analysis of distribution network power supply capacity based on GIS space services. Background technique [0002] With the increasing development of urban power distribution network and the deepening of urban network reconstruction projects, the structure of my country's power distribution network is becoming more and more complex, and the management area is also increasing. However, most of the power distribution systems have relatively weak grid structures, and the construction quality and operation and maintenance level are uneven, resulting in a relatively prominent contradiction between the power supply capacity of the distribution network and the level of electricity demand. In some areas, especially in the urban-rural fringe areas, the phenomenon of overloading of distribution transformers is still serious. Power supply "stuck", frequent ...

Claims


Application Information

Patent Timeline
Patent Type & Authority Patents(China)
IPC IPC(8): G06Q10/06G06Q50/06
CPCG06Q10/06393G06Q50/06
Inventor 蔡宇翔苏运东付婷朱碧钦肖琦敏陈锐董衍旭黄文思李金湖林海玉
Owner STATE GRID FUJIAN ELECTRIC POWER CO LTD
Why Eureka
Try Eureka