Apparatus and method for visualizing data within a decomposition graph

a decomposition graph and data technology, applied in the field of apparatus and method for visualizing data within a decomposition graph, can solve the problems of not providing advanced data visualization, not providing the flexibility to compare and aggregate data,

Active Publication Date: 2009-04-16
BUSINESS OBJECTS SOFTWARE
View PDF10 Cites 22 Cited by
  • Summary
  • Abstract
  • Description
  • Claims
  • Application Information

AI Technical Summary

Benefits of technology

[0009]In view of the foregoing, it would be helpful to provide a solution that allows users to compare the breakdown of complex measures, such as profit, revenue, attrition, growth and the like, over a series of dimensions. Moreover, the flexibility to compare data for multiple measures and dimension members, aggregate data for a desired selection of dimension members and filter data would provide an improvement over existing techniques.

Problems solved by technology

While current decomposition trees show the breakdown of basic information over a series of dimensions, they do not provide advanced data visualization.
This does not provide the user with the flexibility to compare and aggregate data.

Method used


Image

  • Apparatus and method for visualizing data within a decomposition graph
  • Apparatus and method for visualizing data within a decomposition graph
  • Apparatus and method for visualizing data within a decomposition graph

Examples


Embodiment Construction

[0022]The following terminology is used while disclosing embodiments of the invention:

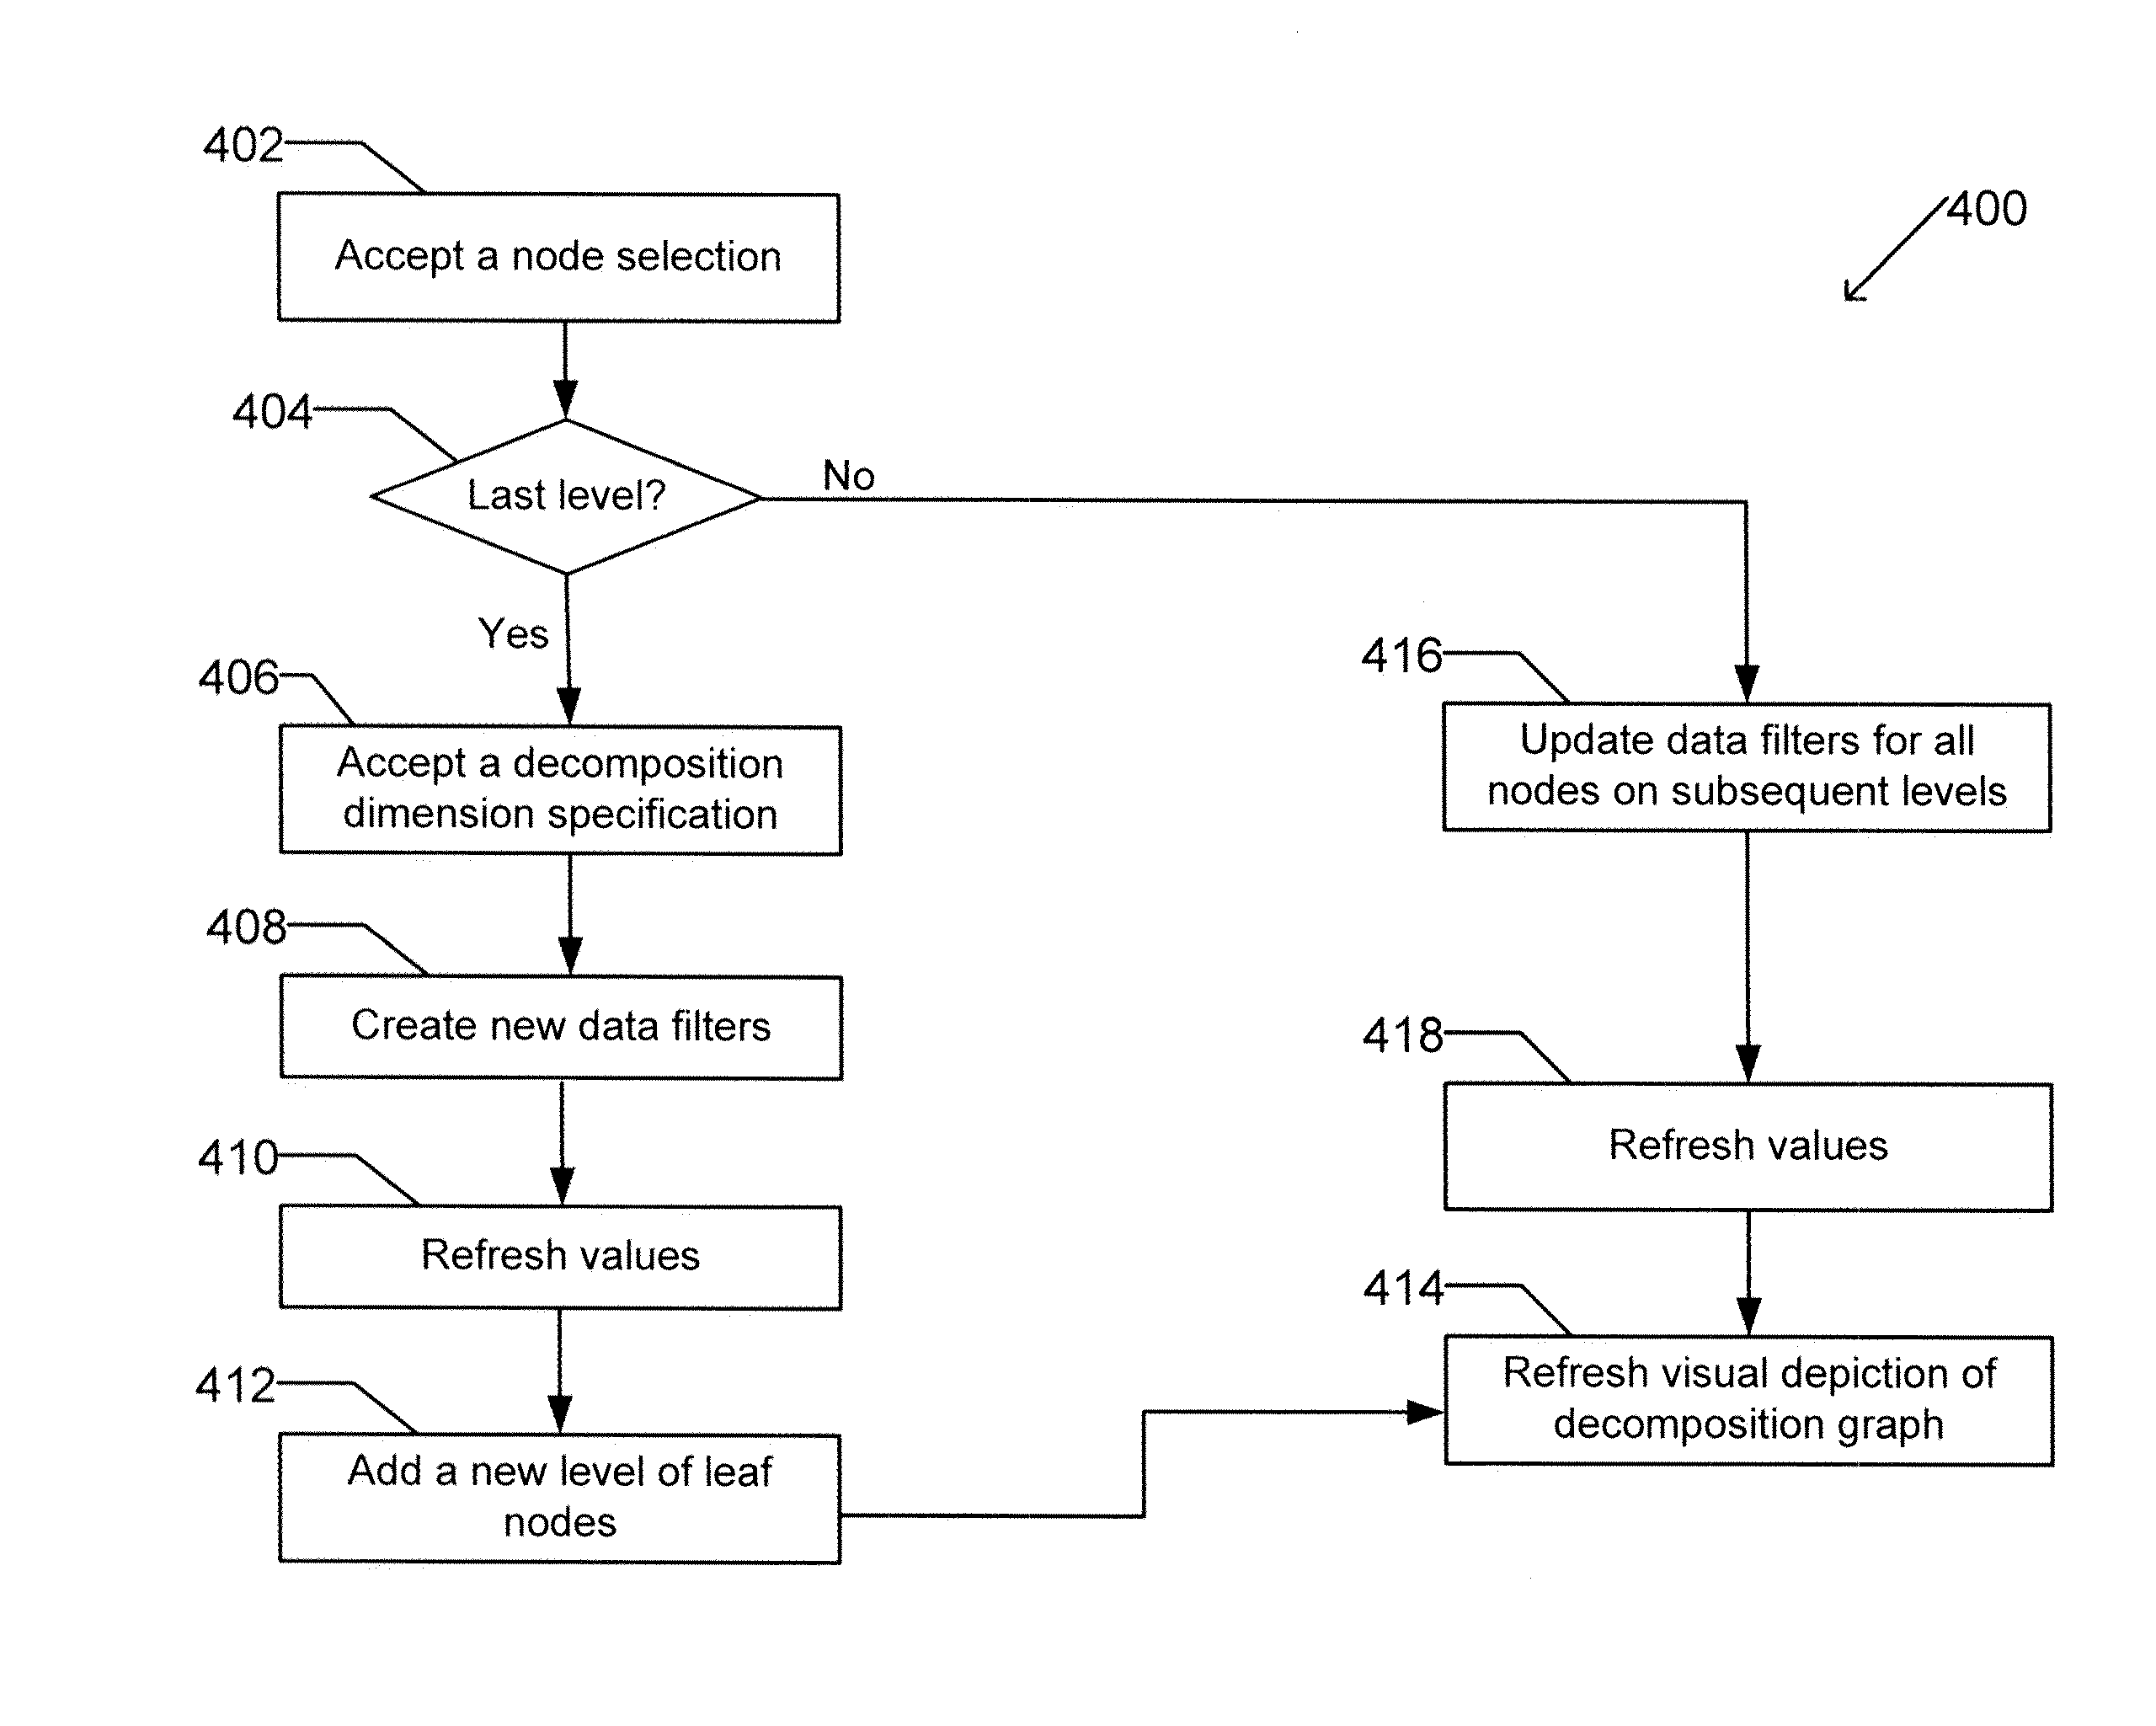
[0023]A decomposition graph is a visualization of a set of levels of nodes. A decomposition graph is a visual depiction of a directed graph that displays data in a hierarchical format. It illustrates a staged break down of a data set over a series of one or more dimensions. Subsequent levels of the decomposition graph break the data down into smaller subsets by applying a new dimension. For example, data on the third level of a decomposition graph may be broken down by year, geography and product. A decomposition graph differs from a decomposition tree in that a node can have more than one parent.

[0024]A node is a visual depiction of a component of a decomposition graph A node is depicted in a specific level of a decomposition graph hierarchy. A node is depicted in relation to other nodes within a decomposition graph. A node is associated with a data set and can contain a measure visualization.

[002...


PUM


Abstract

A computer readable storage medium includes executable instructions to provide a decomposition graph visualization with a set of nodes. A selection of two or more measures is received. A measure visualization is generated for each node to illustrate a relationship between the two or more measures.

Description

BRIEF DESCRIPTION OF THE INVENTION[0001]This invention relates generally to data visualization. More particularly, this invention relates to performing data visualization within a decomposition graph.BACKGROUND OF THE INVENTION[0002]Business Intelligence (BI) generally refers to a category of software systems and applications used to improve business enterprise decision-making and governance. These software tools provide techniques for analyzing and leveraging enterprise applications and data. These tools are commonly applied to financial, human resource, marketing, sales, service provision, and customer and supplier analyses. More specifically, these tools can include: reporting and analysis tools to analyze, forecast and present information, content delivery infrastructure systems for delivery, storage and management of reports and analytics, data warehousing systems for cleansing and consolidating information from disparate sources, and integration tools to analyze and generate w...

Claims


Application Information

Patent Timeline
Patent Type & Authority Applications(United States)
IPC IPC(8): G06F17/30G06F3/048
CPCG06T11/206
Inventor DUMANT, BRUNO ANDRE MARIENAIBO, ALEXIS-JEAN LAURENTGROSSELIN, JEAN-CLAUDE
Owner BUSINESS OBJECTS SOFTWARE
Why Eureka
Try Eureka