Display of data used for system performance analysis

a technology of system performance and data, applied in the field of display of data used to analyze system performance, can solve problems such as system failure, difficulty in diagnosing problems, and less experienced users not knowing which types of information are relevan

Inactive Publication Date: 2012-03-20
GLOBALFOUNDRIES INC
View PDF20 Cites 18 Cited by
  • Summary
  • Abstract
  • Description
  • Claims
  • Application Information

AI Technical Summary

Problems solved by technology

In large software runtime environments, such as, server environments, it is often difficult to diagnose problems in a system because any number of seemingly unrelated factors may interact and result in performance issues or system failure.
Additionally, less experienced users may not know which types of information are relevant for a particular system problem.
Diagnosing system problems is further complicated by the fact that information necessary for diagnosis may need to be viewed using multiple viewers that are unlikely to be synchronized.
Hence, a big picture view of what was happening in the system when a particular problem occurred will not be available.

Method used


Image

  • Display of data used for system performance analysis
  • Display of data used for system performance analysis
  • Display of data used for system performance analysis

Examples


Embodiment Construction

[0012]The present invention generally relates to displaying data used to analyze system performance. The following description is presented to enable one of ordinary skill in the art to make and use the invention and is provided in the context of a patent application and its requirements. The present invention is not intended to be limited to the implementations shown, but is to be accorded the widest scope consistent with the principles and features described herein.

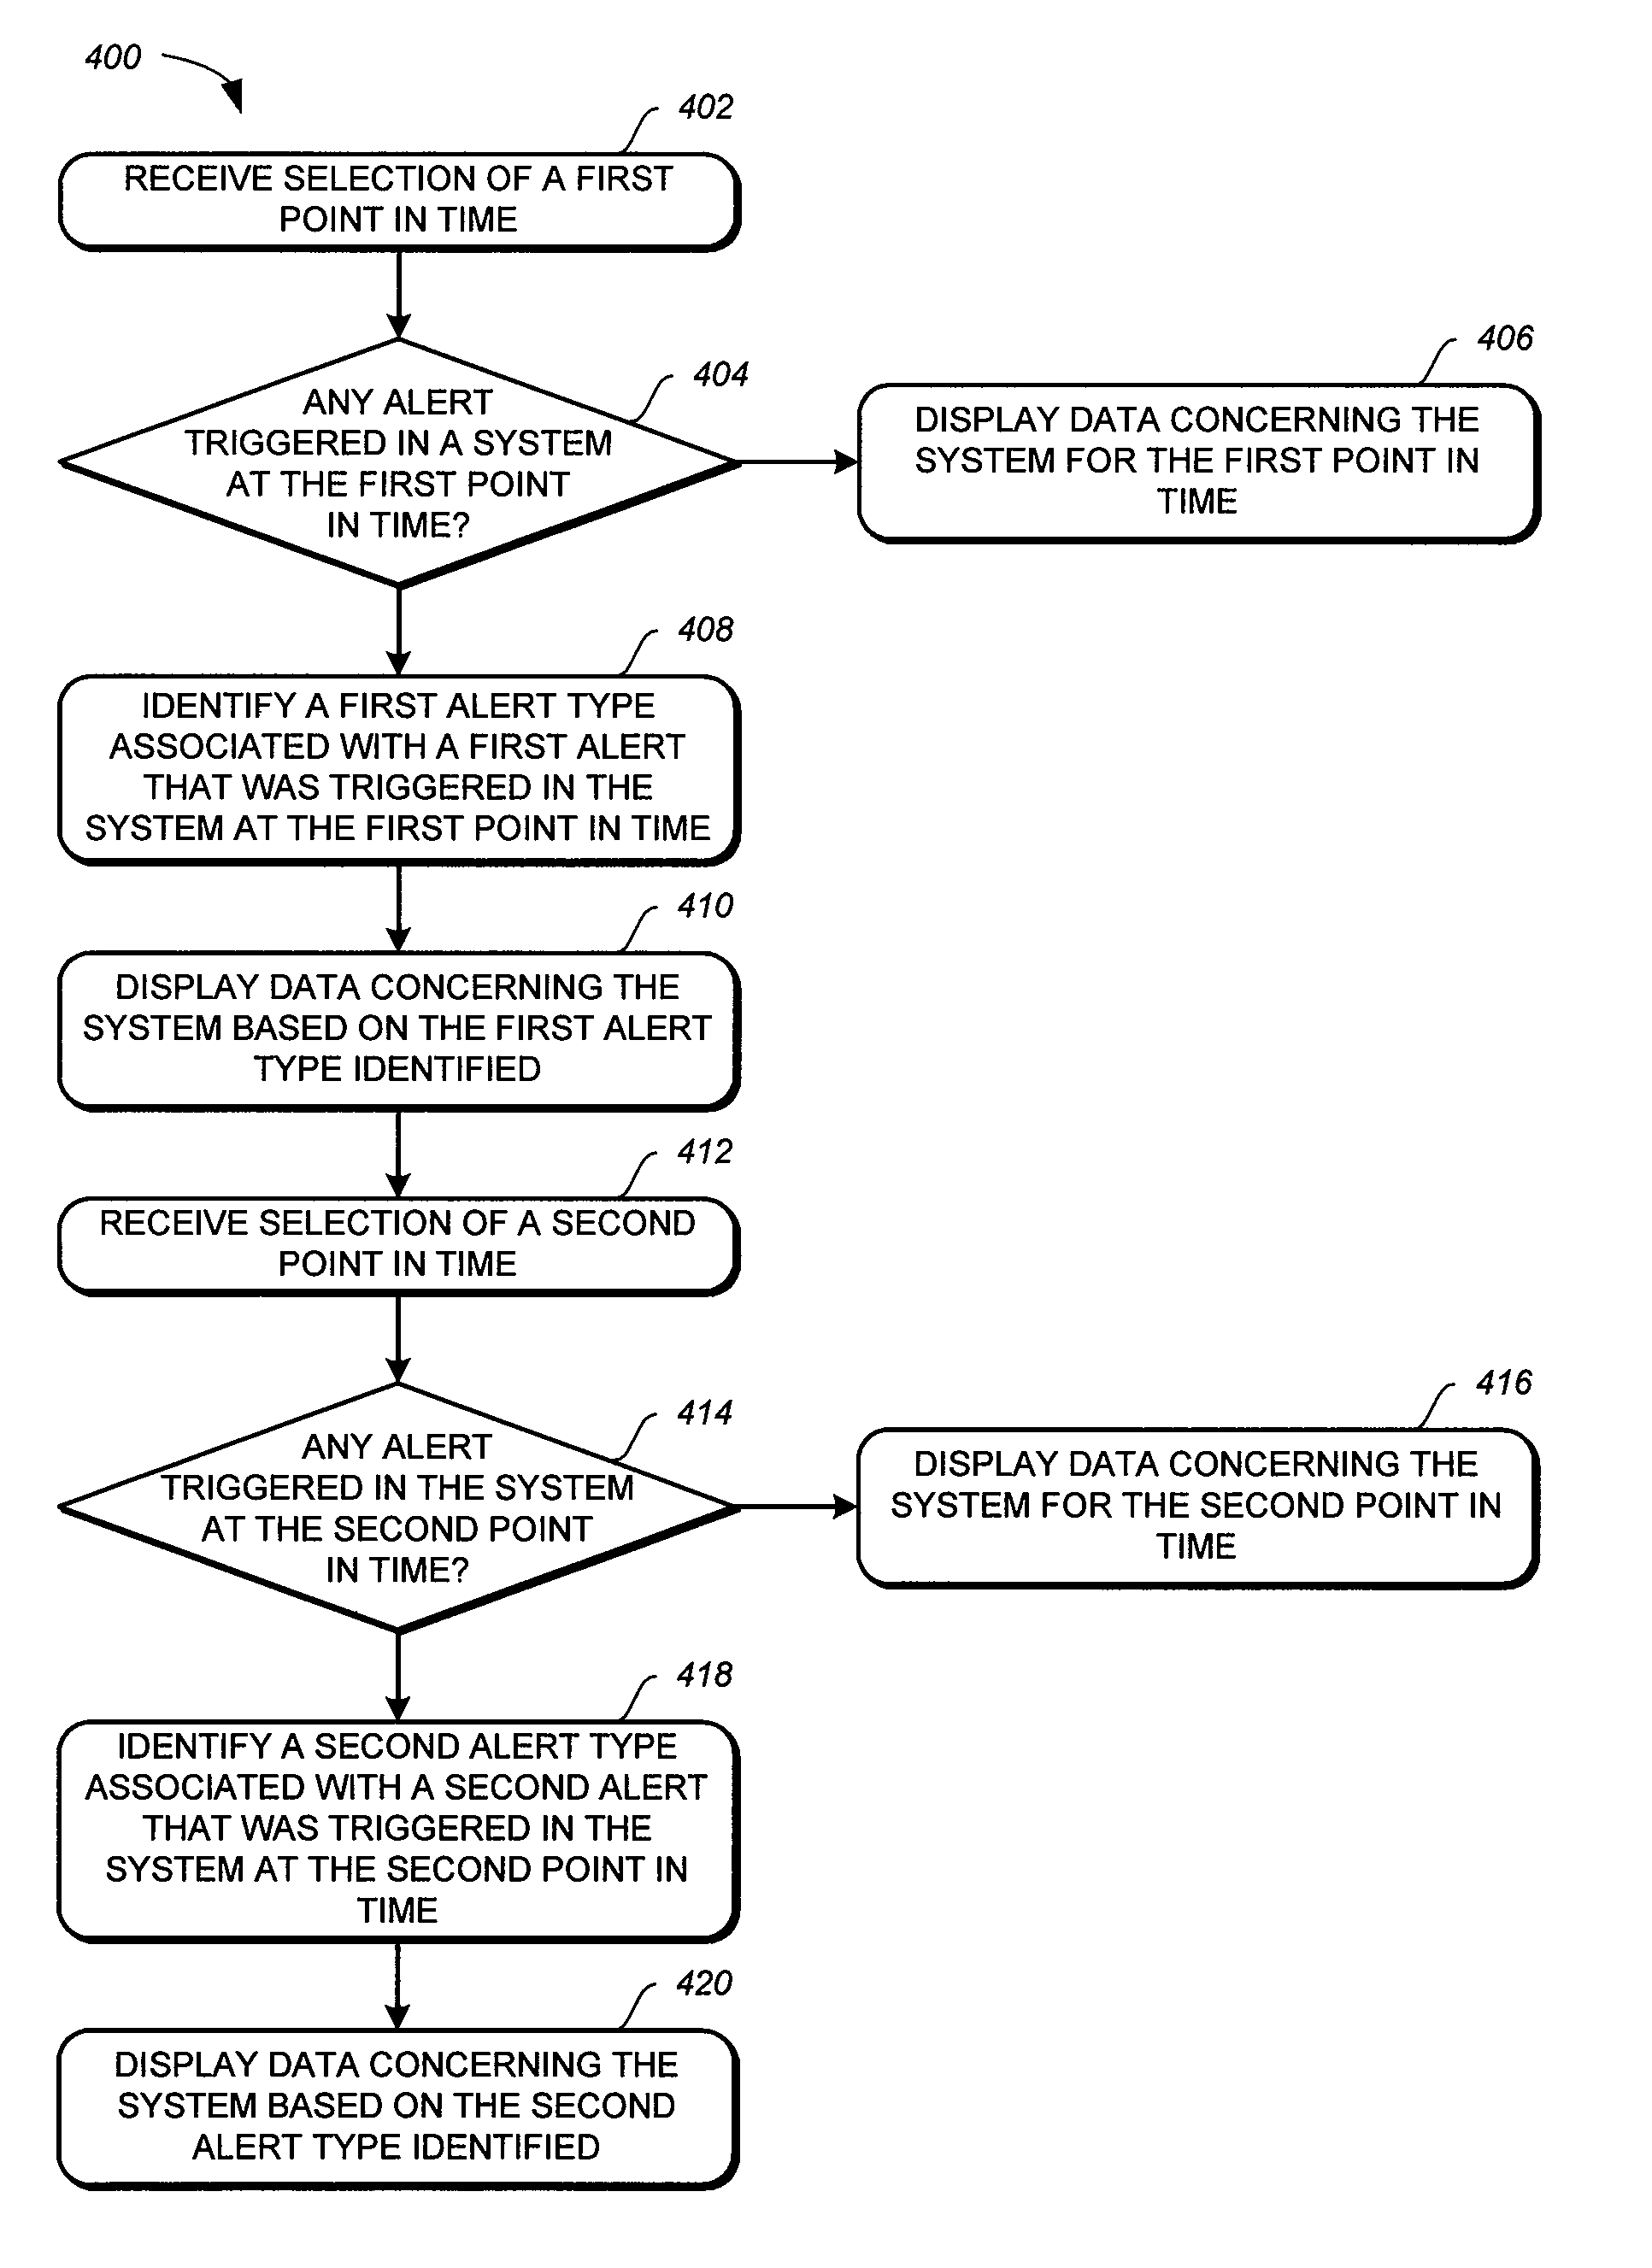
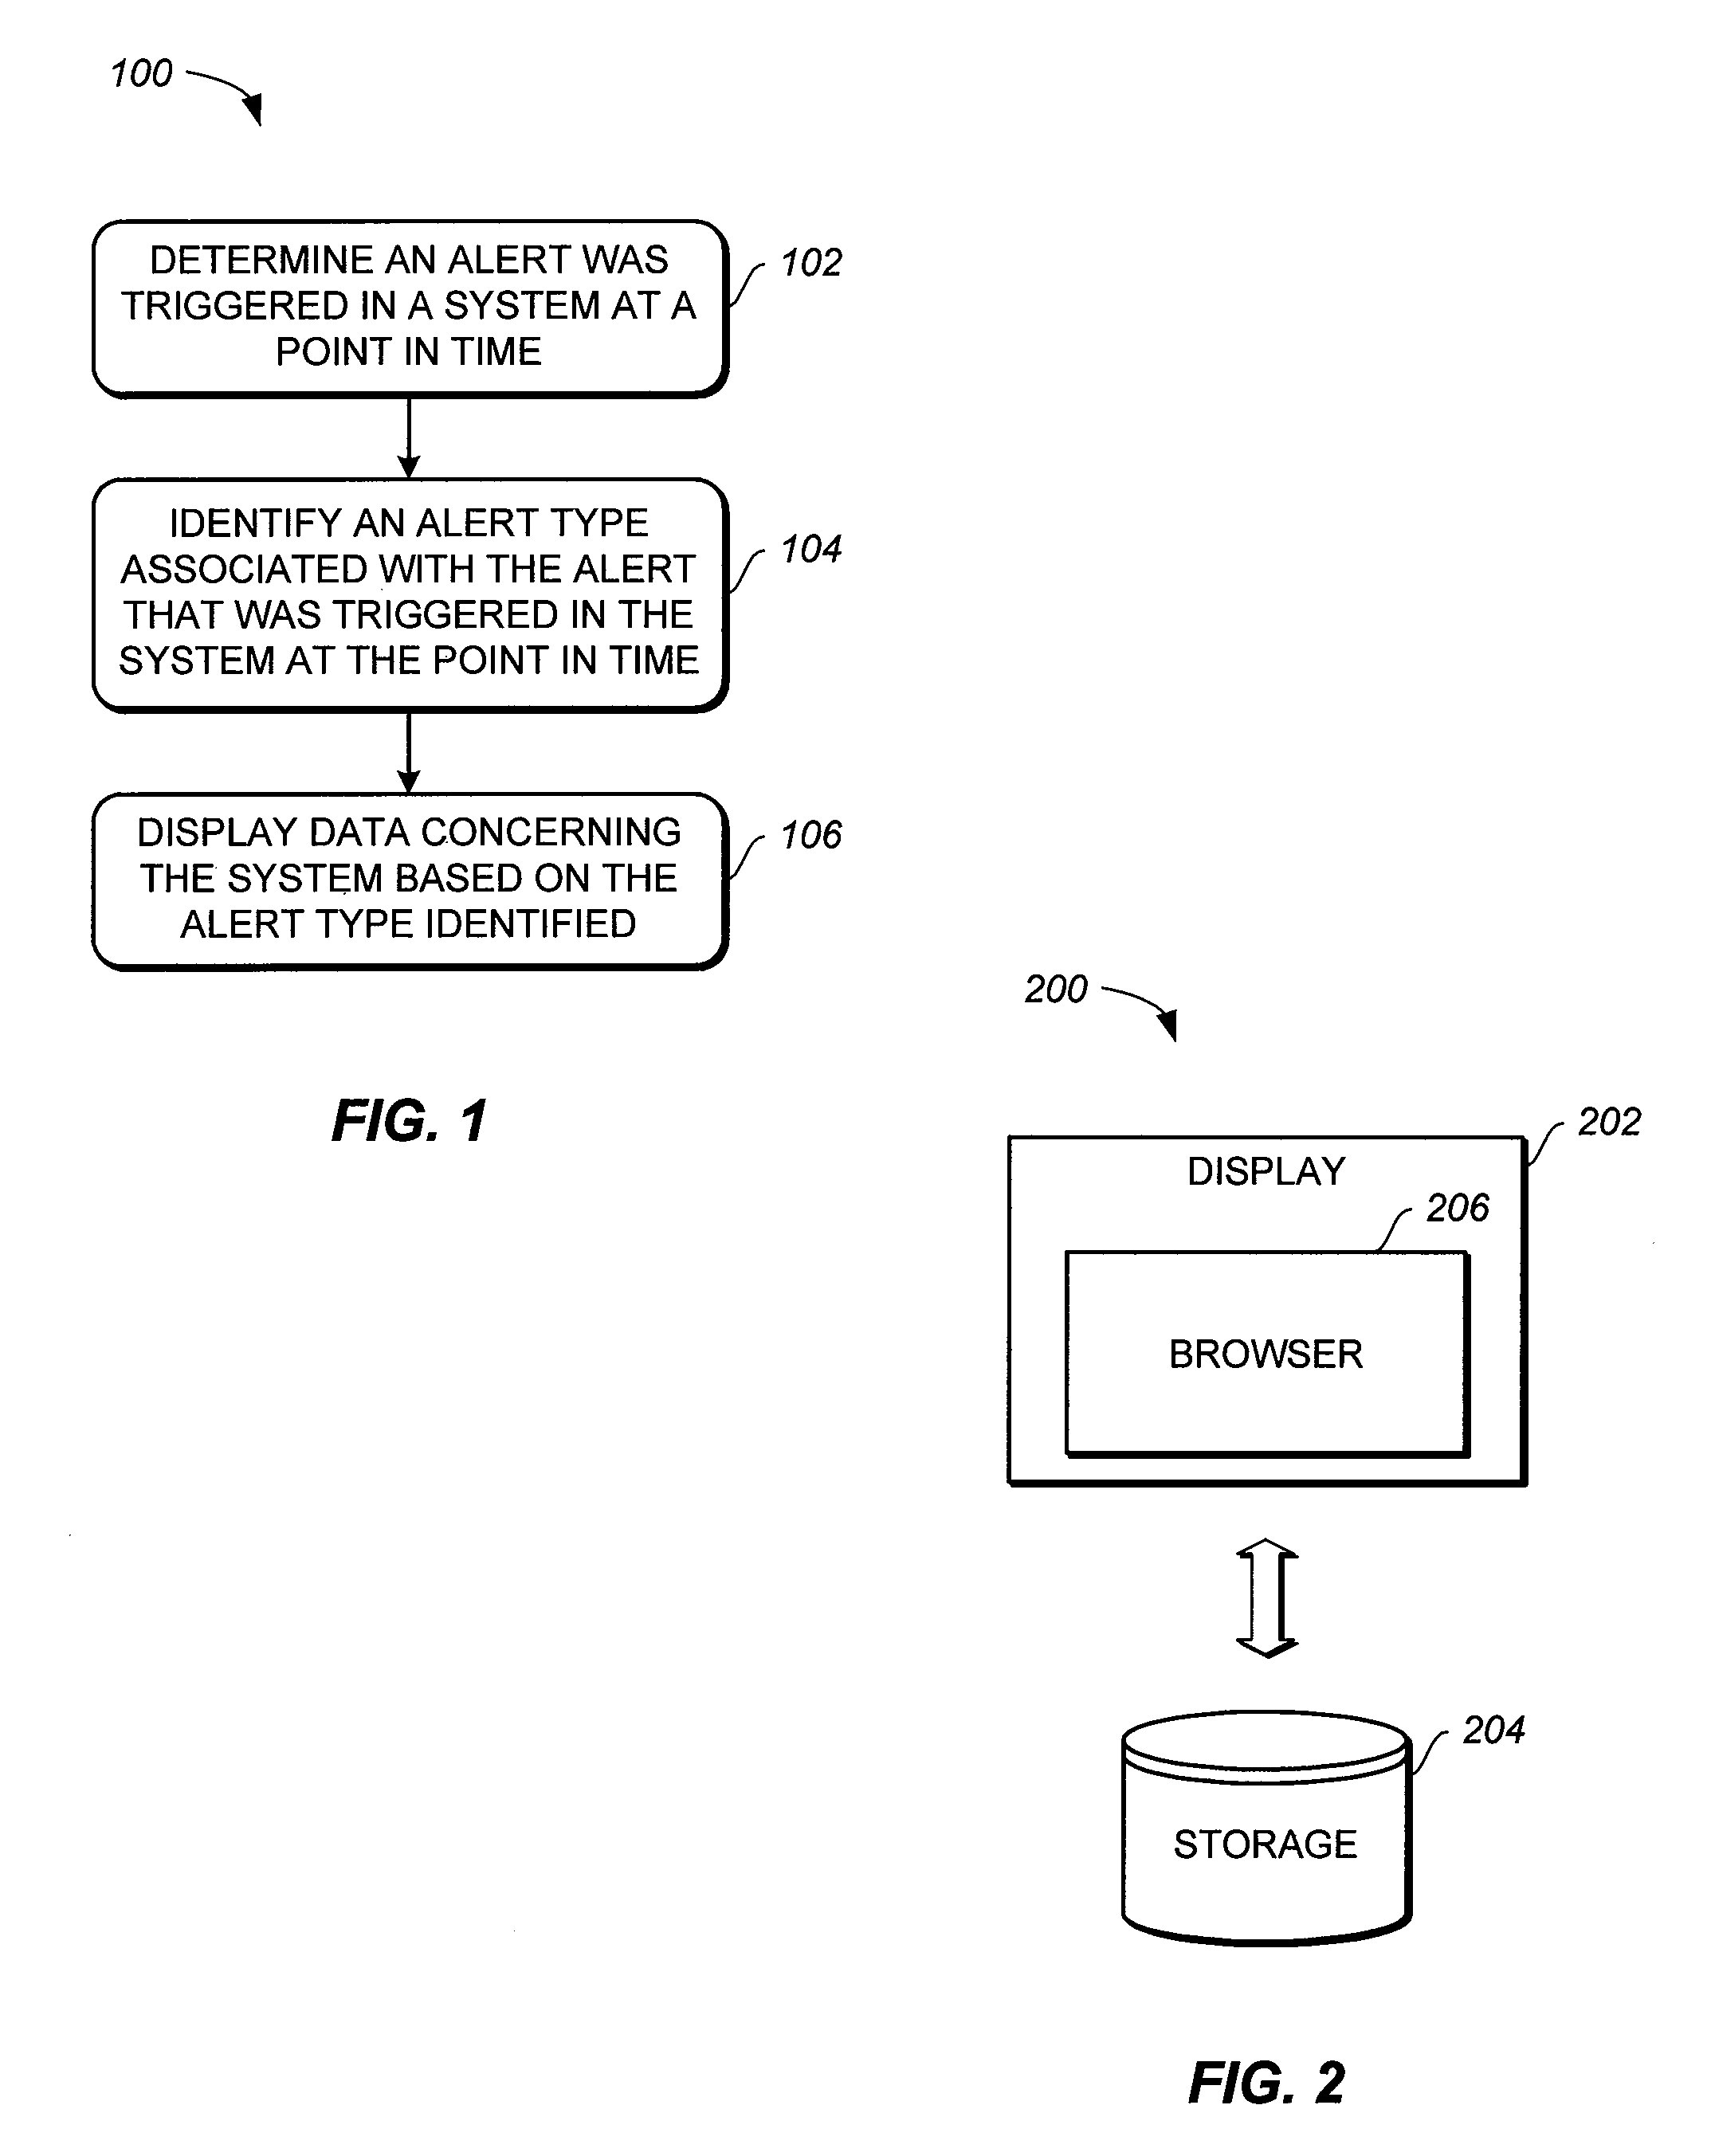
[0013]When problems occur in large software runtime environments, such as server environments, it is often difficult to diagnose the problems. The difficulty arises from the fact that any number of seemingly unrelated factors may interact and result in system failure, performance issue, or the like. Diagnosing system problems in large software runtime environments is also difficult because information useful in diagnosing the system problems may be stored in a variety of places. In addition, knowing which types of infor...


PUM


Abstract

Method, system, and computer program product for displaying data used to analyze system performance are provided. The method, system, and computer program product provides for determining an alert was triggered in a system at a point in time, identifying an alert type associated with the alert that was triggered in the system at the point in time, and displaying data concerning the system based on the alert type identified, the data displayed comprising a subset of a plurality of types of data available concerning the system, the subset being selected based on the alert type identified.

Description

FIELD OF THE INVENTION[0001]The present invention relates generally to displaying data used to analyze system performance.BACKGROUND OF THE INVENTION[0002]In large software runtime environments, such as, server environments, it is often difficult to diagnose problems in a system because any number of seemingly unrelated factors may interact and result in performance issues or system failure. Information useful in diagnosing system problems, such as logs, performance measurements, and so forth, may also be scattered in a variety of places. Additionally, less experienced users may not know which types of information are relevant for a particular system problem. Diagnosing system problems is further complicated by the fact that information necessary for diagnosis may need to be viewed using multiple viewers that are unlikely to be synchronized. Hence, a big picture view of what was happening in the system when a particular problem occurred will not be available.SUMMARY OF THE INVENTION...

Claims


Application Information

Patent Timeline
Patent Type & Authority Patents(United States)
IPC IPC(8): G06F11/00
CPCG06F11/327
Inventor GLASER, HOWARD JUSTINBARRIOS, DAIV SANTOSNOVAK, MATTHEW WAYNEXIA, CHENHONG
Owner GLOBALFOUNDRIES INC
Why Eureka
Try Eureka