Method, tool and device for debugging application program

A technology of application programs and debugging methods, applied in the field of debugging, can solve the problems that the system is easy to enter an uncertain state and is difficult to repeat

CN101739333AInactive Publication Date: 2010-06-16IBM CN
1 Cites 41 Cited by

Patent Information

Authority / Receiving Office
CN · China
Patent Type
Applications(China)
Current Assignee / Owner
Publication Date
2010-06-16
Estimated Expiration
Not applicable · inactive patent

Smart Images

  • Figure 1
    Figure 1
  • Figure 2
    Figure 2
  • Figure 3
    Figure 3
Patent Text Reader

Abstract

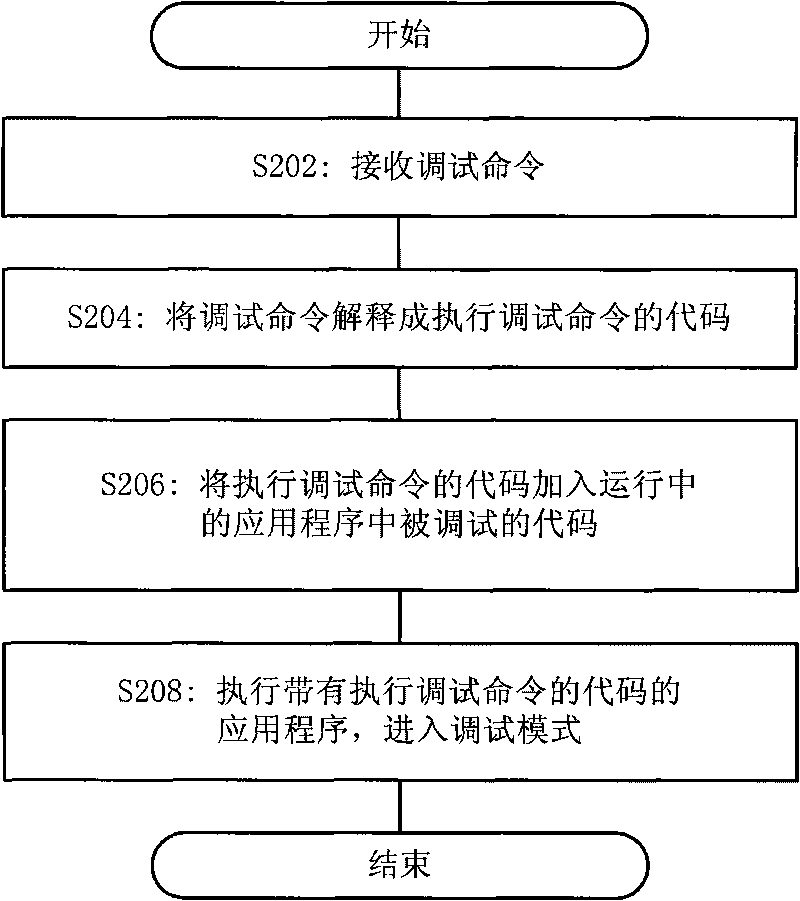
The invention provides a method, a tool and a device for debugging an application program. The debugging method comprises the following steps of: receiving a debugging command, wherein the debugging command at least specifies a debugged code in the running application program; interpreting the debugging command into a code for performing the debugging command; adding the code for performing the debugging command into the debugged code in the running application program; and performing an application program with the code for performing the debugging command, thus entering a debugging mode. The method for debugging the application program does not need to restart the application program, is favorable for debugging a system inconvenient to interrupt, and solves a program defect which can cause difficultly repetitive failure in running.
Need to check novelty before this filing date? Find Prior Art

Description

technical field

[0001] The present invention relates to the field of debugging, and more particularly, the present invention relates to methods and tools for debugging software programs. Background technique

[0002] Today, when software technology is becoming more and more popular, debugging technology is an indispensable technology. Currently, programmers usually rely on debuggers for debugging operations. A debugger is an application or system that reads system tables and enables the programmer to interrupt (or suspend) execution of the program being debugged to display and inspect code, calculate and edit variables in the program, view registers, and View memory space used by applications. Generally speaking, the main debugging operations include: set a breakpoint - interrupt program execution when a certain line of code is executed (this operation is useful for checking error conditions); specify variables - change internal program variables, and see how the program r...

Examples

Embodiment Construction

[0021] Hereinafter, the debugging method and debugging tool of the present invention will be described in detail through embodiments with reference to the accompanying drawings. The following embodiments are described by taking the JAVA environment as an example, and those skilled in the art should understand that the present invention is not limited to the JAVA environment.

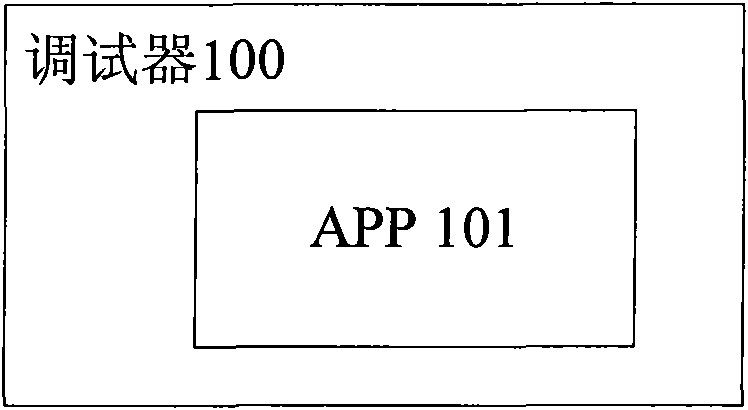
[0022] In existing debugging methods, when a problem occurs in an application running in a normal mode on an actual application platform, the tester usually needs to stop the running of the application. Then, restart the application in debug mode in the debugger to debug the application and find and correct errors. Finally, after debugging is complete, restart the application in normal mode on the actual application platform. figure 1 The relationship between the debugger 100 and the application program APP101 is schematically shown. The APP 101 runs in the environment simulated by the debugger 100, ju...