Terminal pie chart rotation interactive display method and terminal

A technology of rotating interaction and display method, applied in the field of data statistics, can solve the problems of unable to display, narrow terminal display screen, unable to display statistical item information, etc., to achieve the effect of solving incomplete display

Inactive Publication Date: 2012-05-16
深圳市随手科技有限公司
View PDF2 Cites 5 Cited by
  • Summary
  • Abstract
  • Description
  • Claims
  • Application Information

AI Technical Summary

Problems solved by technology

[0003] Displaying pie charts on the terminal display screen in the traditional way cannot achieve friendly interaction of classified data information
Due to the narrowness of the terminal display screen, the pie chart slice cannot be clicked with a finger or a touch pen, and too much data cannot

Method used


Image

  • Terminal pie chart rotation interactive display method and terminal
  • Terminal pie chart rotation interactive display method and terminal
  • Terminal pie chart rotation interactive display method and terminal

Examples


Embodiment Construction

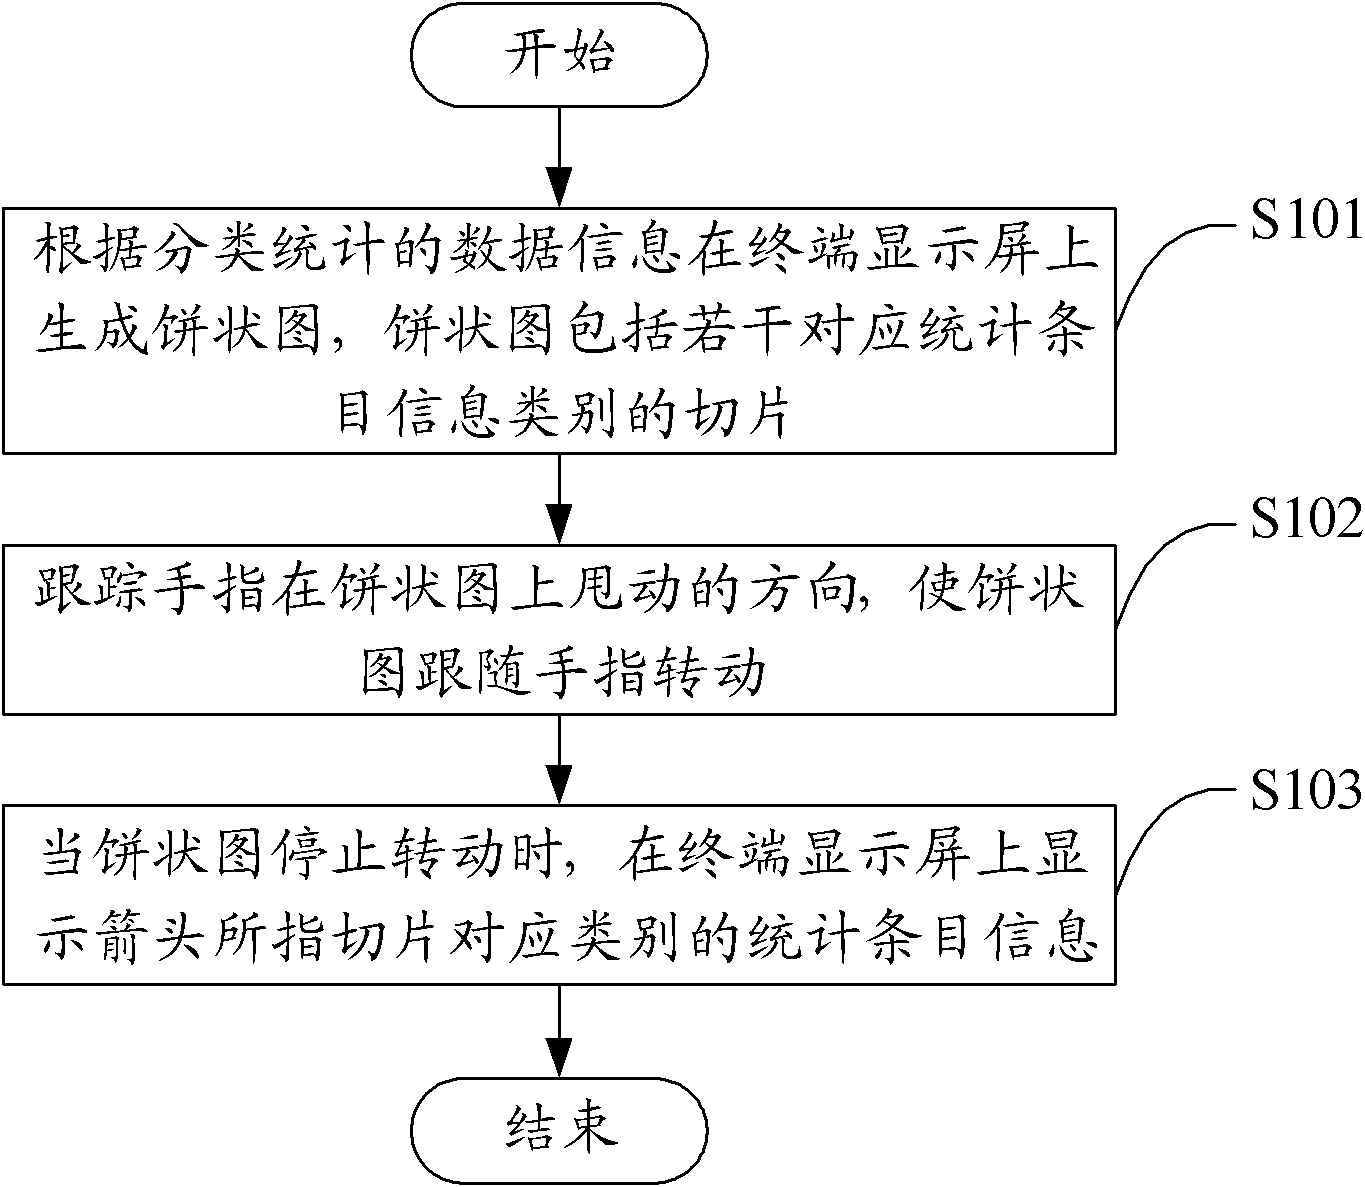
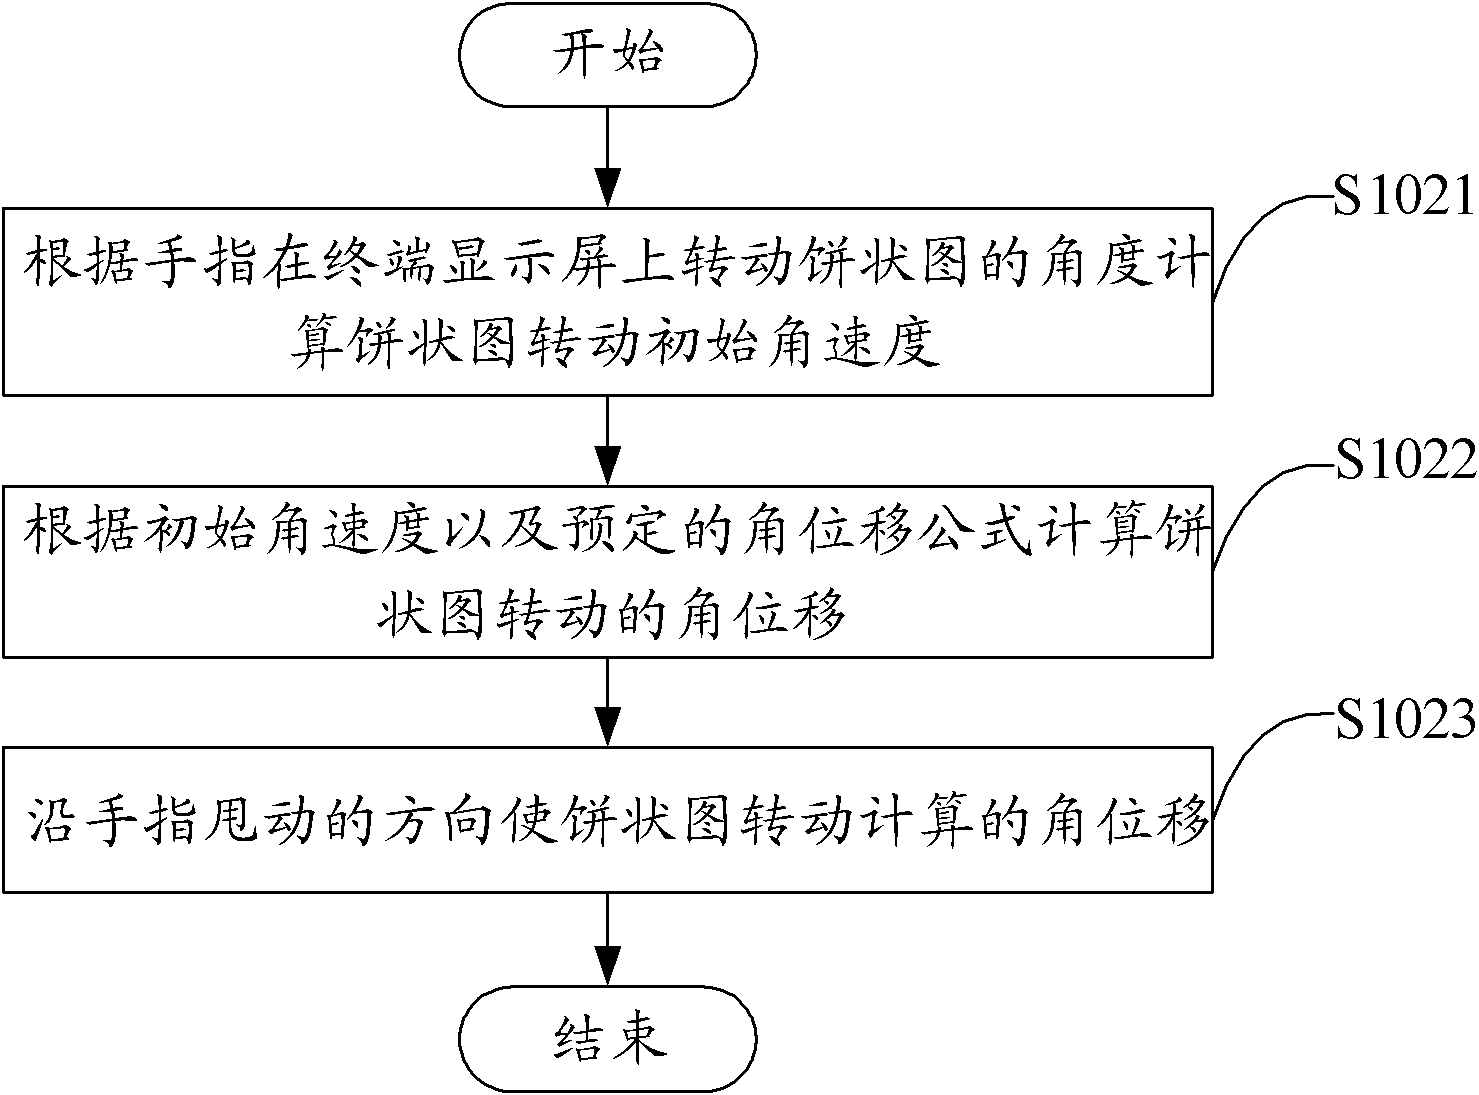
[0032] The solution of the embodiment of the present invention is mainly to make the pie chart rotate in the direction of finger swing by simulating the physical effect of the roulette rotation, and make the pie chart move at different speeds with uniform deceleration according to the speed of finger swing on the display screen , when a specific pie chart slice falls into the arrow area, the summary information of the slice data, that is, the statistical entry information, is displayed in the arrow area.

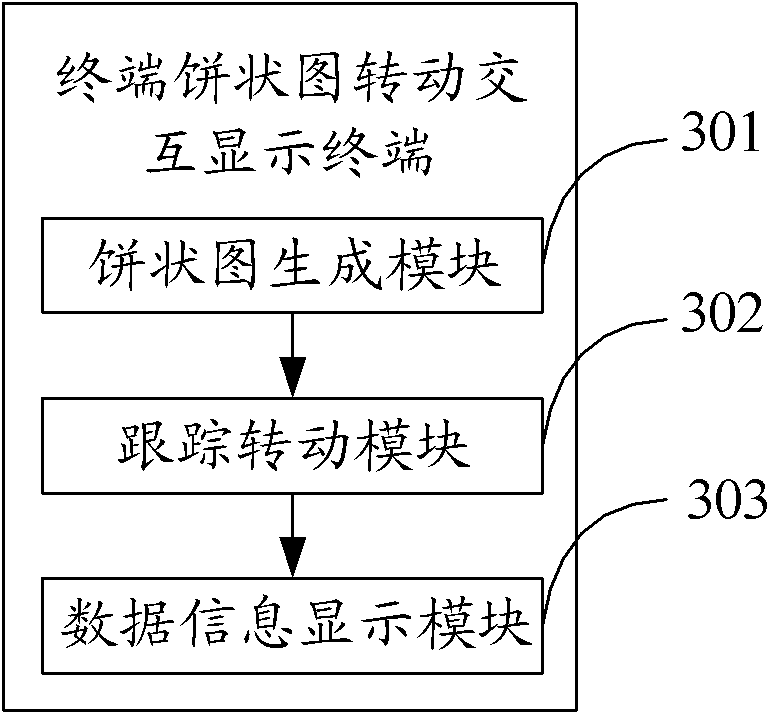
[0033] In view of the problem in the prior art that the statistical entry information corresponding to the pie chart slices cannot be displayed on the same screen of the terminal display screen when there are a large number of pie chart slices, the embodiment of the present invention simulates the physical effect of the rotation of the roulette. Display the statistical entry information corresponding to the specified pie chart slice.

[0034] Such as figure 1 As shown, an e...


PUM


Abstract

The invention relates to a terminal pie chart rotation interactive display method and terminal. The method comprises the following steps: generating a pie chart on a terminal display screen according to data information of classification statistics, wherein the pie chart comprises a plurality of sectors corresponding to statistic item information classes; tracking the swing direction of a finger on the pie chart, and enabling the pie chart to rotate along with the finger; and when the pie chart stops rotating, displaying the statistic item information of the class corresponding to the sector pointed by a display arrow on the terminal display screen. By simulating the physical effect of the disk rotation, the pie chart is enabled to rotate along with the swing direction of the finger and to make a uniformly retarded motion at different speeds according to the swing speed of the finger on the display screen; and when the specific pie chart sector falls into the arrow region, the statistic item information of the class corresponding to the sector displayed by the arrow region. The invention solves the problem of insecure display of statistic item information when the quantity of the sectors of the pie chart is high.

Description

technical field [0001] The invention relates to the technical field of data statistics, in particular to a terminal pie chart rotation interactive display method and a terminal. Background technique [0002] Classification and statistics of data information in the form of data tables is a common method used by various businesses at present. There are many ways to display the statistical results, such as pie charts, histograms or other tables on the terminal display screen. [0003] Displaying pie charts on the terminal display screen in the traditional way cannot achieve friendly interaction of classified data information. Due to the narrowness of the terminal display screen, the pie chart slice cannot be clicked with a finger or a touch pen, and too much data cannot be displayed on the pie chart slice to illustrate the statistical entry content of the slice, but each slice can only be displayed through a list Statistical entry information, so in the case of a large number ...

Claims


Application Information

Patent Timeline
IPC IPC(8): G06F3/048G06F3/0481G06F3/0484
Inventor 郑俊文
Owner 深圳市随手科技有限公司
Why Eureka
Try Eureka