GIS-based power dispatching data graphical display method

A graphical display and power dispatching technology, applied in the field of electric power geographic information system, can solve the problems of time delay, waste of manpower and material resources, unable to display geographical location and surrounding environment, etc., to achieve the effect of monitoring dispatching data intuitively and displaying dispatching data in real time.

Active Publication Date: 2015-04-22
STATE GRID CORP OF CHINA +2
View PDF4 Cites 5 Cited by
  • Summary
  • Abstract
  • Description
  • Claims
  • Application Information

AI Technical Summary

Problems solved by technology

[0002] With the in-depth development of the national grid information work, the power grid GIS platform and dispatching SCADA system are playing an increasingly important role in their respective fields, but the dispatching data has always had the disadvantage that the display is not intuitive enough.
At present, the display methods of power dispatching data are mainly in the form of tables or network contact diagrams, etc. The former can only view and count data, neither can display the connection relationship between equipment and lines, nor can it display their actual geographical location and surroundings environment, while the latter can show the connection relationship between devices and lines, but cannot show their actual geographical location and surrounding environment
This brings a lot of inconvenience to the work of dispatching relevant personnel, especially when a problem is found, it is necessary to repeatedly check information such as tables, network contact maps, maps, etc., which not only wastes manpower and material resources, but also delays time

Method used


Image

  • GIS-based power dispatching data graphical display method
  • GIS-based power dispatching data graphical display method
  • GIS-based power dispatching data graphical display method

Examples


example

[0072] (1) Establish the corresponding relationship table between the GIS platform and the equipment in the SCADA system. The specific steps include:

[0073] ① Distribution line information in the GIS platform: 67EA8DAF673D4B2C8B895145DC525E51421B0108861, Tianhe 176 Tiangang Line 1, 10kV, urban network, overhead lines, Xingtai Power Supply Company, 220kV Tianhe Station.

[0074] ②SCADA system line information: 116812117079753143, Hebei. Tianhe Station / 110kV. Tiangang Line 1 Line 176.

[0075] ③ Establish the corresponding relationship between the GIS platform and the SCADA system: 67EA8DAF673D4B2C8B895145DC525E51421B0108861, Tianhe 176 Tiangang Line 1, 116812117079753143, Hebei. Tianhe Station / 110kV. Tiangang 1 Line 176 Line.

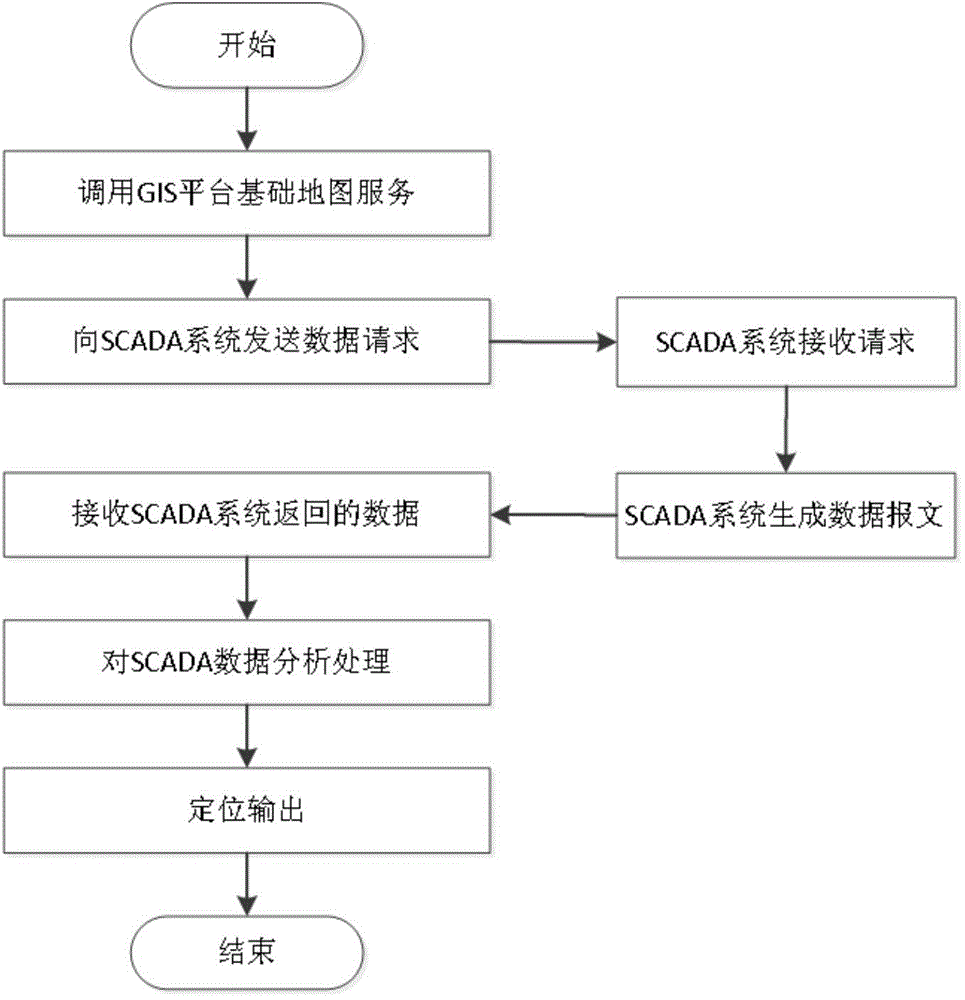
[0076] (2) Use WebService / JMS to interact with the gateway.

[0077] (3) Call the GIS platform service and request scheduling data from the SCADA system.

[0078] (4) Send data request to SCADA system.

[0079] (5) The SCADA system receives the requ...


PUM


Abstract

The invention relates to a GIS-based power dispatching data graphical display method comprising the following steps: (1) an equipment correspondence table of a GIS platform and an SCADA system is established; (2) the path and interface format for requesting map data and scheduling data are defined; (3) a GIS platform service is called and scheduling data is requested to the SCADA system; (4) a data request is sent to the SCADA system; (5) the SCADA system receives the request; (6) the SCADA system generates a data message; (7) data returned by the SCADA system is received; (8) the SCADA data is analyzed and processed; and (9) the data is positioned and output. According to the method of the invention, the installed file is small, the access path is simple and clear, and the goal of power dispatching data graphical display is achieved by making use of a power grid GIS platform map and a topology service and based on the equipment correspondence of the power grid GIS platform and the power dispatching SCADA system.

Description

technical field [0001] The invention belongs to the technical field of electric power geographic information systems, and in particular relates to a GIS-based power scheduling data graphical display method. Background technique [0002] With the in-depth development of the national grid information work, the power grid GIS platform and dispatching SCADA system are playing more and more roles in their respective fields, but the display of dispatching data has always had the disadvantage of not being intuitive enough. At present, the display methods of power dispatching data are mainly in the form of tables or network contact diagrams, etc. The former can only view and count data, neither can display the connection relationship between equipment and lines, nor can it display their actual geographical location and surroundings environment, while the latter can show the connection relationship between devices and lines, but cannot show their actual geographic location and surrou...

Claims


Application Information

Patent Timeline
IPC IPC(8): G06Q50/06G06F17/30
CPCG06F16/29G06Q50/06
Inventor 景皓潘瑾庞先海孙中记李晓峰刘婷胡涛
Owner STATE GRID CORP OF CHINA
Why Eureka
Try Eureka